Dear Friends and Partners,
In the first half of 2021, the Flexible Fixed Income Fund returned +6.3%. Since the Fund’s inception in early 2016, it has delivered a compound annual return of +7.4%.
2021 has been a period of differentiation for the fund. Despite having low net exposure relative to its history, the Fund has produced returns meaningfully in excess of its benchmarks. This is owing to our continued application of the Fund’s flexible investment strategy, owning a narrow collection of favorable ideas across the credit spectrum. With the exception of glaring sector-wide pricing distortions, which we take periodic advantage of, we continue to be focused on opportunities at the micro-level. Individual opportunities and portfolio composition may vary in security type - secured, unsecured, convertible, preferred – but our focus on risk adjusted returns remains the same.
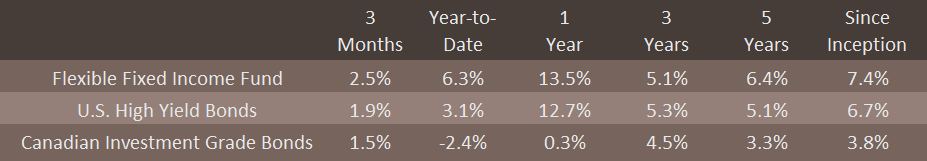
Ewing Morris Flexible Fixed Income Fund LP returns reflect Class P - Master Series, net of fees and expenses. Inception date of the Fund is February 1, 2016. U.S. High Yield Bonds are represented by the iShares U.S. High Yield Bond Index ETF (CAD-Hedged). Canadian Investment Grade Bonds are represented by the iShares Canadian Corporate Bond Index ETF.
2021: A Year of Many Firsts
To say that 2021 is an unusual year is like saying that Warren Buffett or Mark Leonard is an above average investor (a massive understatement, to be clear). This year has been host to a wide variety of phenomena that make this part of the cycle as exciting and entertaining as they are foreboding:
Former US Treasury Secretary Larry Summers remarked this month:
"We're driving our car at 100 miles an hour on a road that is empty right now but won't always be empty and I don't know what form the accident will come, but when you're driving 100 miles an hour it's probably not actually the fastest way to get where you're going because you're likely to have some kind of dislocation."
As the Federal Reserve begins to consider winding down its record stimulus programs, this perspective lands quite well. In the meantime, we continue to marvel at a situation where monetary and fiscal stimulus have combined to fuel a spectacular inflation of nearly all financial assets. “Stimmy checks” sent to many Americans have contributed to a replay reminiscent of the dot-com bubble, where retail investors are back to being a prominent feature of the market, causing massive distortions in certain areas of markets. What is different this time around is that social media has proven to be a potent accelerant, encouraging "YOLO" (you only live once) and "FOMO" (fear of missing out) behaviour in many assets including:
"Meme investments" such as Gamestop and Dogecoin. Gamestop equity saw a 17-fold increase in the month of January. Dogecoin, a cryptocurrency that was originally made as a joke, saw a 52-fold year-to-date rally by May to reach a peak aggregate market value of 89 billion dollars.1
Bitcoin. The apparent posterchild of the Bitcoin craze is Michael Saylor. Saylor is the CEO of a multibillion dollar publicly traded, software-turned-bitcoin-holding company and in June told investors “once you know how it all ends, the only use of time is, ‘How do I buy more Bitcoin?’ Take all your money, buy Bitcoin…. and if you absolutely love the thing that you don't want to sell, go mortgage your house and buy bitcoin with it and if you've got a business that you love because your family works for the business, it's in your family for 37 years and you can't bear to sell it, mortgage it and convert the proceeds into the hardest money on earth which is bitcoin.”
Finally, we are seeing other things like a single-location deli in New Jersey that generated only fourteen thousand dollars in sales in 2020 that somehow saw a two billion dollar valuation. For those looking to get rich quick by merging a frozen banana stand into a SPAC, this has been the year to do it.
High Expectations
All of these anecdotes bring to life just how untethered from reality securities prices can get. By many measures, equity and credit markets are pricing in the smoothest of future conditions. The economy will grow. The Federal Reserve will deftly taper and normalize interest rates. Inflation will moderate. Geopolitical conflicts will cool. These are the types of assumptions that seem embedded in the market consensus, for now.
Just as Jeff Bezos has remarked “the stock is not the company and the company is not the stock”, the same can be said about the economy and financial markets. It is intuitive that the performance of these two entities should have a relatively tight relationship, but this isn’t always the case. History demonstrates that even when we have seen excellent economic growth, it is actually far from certain that financial markets will closely match these outcomes. It would probably strike most people as impossible that we could see a flat stock market amidst an economic expansion of 300%2, but that is precisely what happened in the United States from early 1966 to late 1982. This fact of history bears repeating. Over a period lasting nearly 17 years, the Dow Jones Industrial Average Index (DJIA) saw essentially no gain in price while the economy expanded by approximately 320 percent. If we adjust both indices similarly for inflation3 the result is equally staggering: the DJIA declined by 66 percent in real terms while the economy expanded by 54%4. In retrospect, it was not particularly surprising to see in 1977 Warren Buffett write in Fortune explaining to the investing public “How Inflation Swindles the Equity Investor.” The economy is not the market indeed.

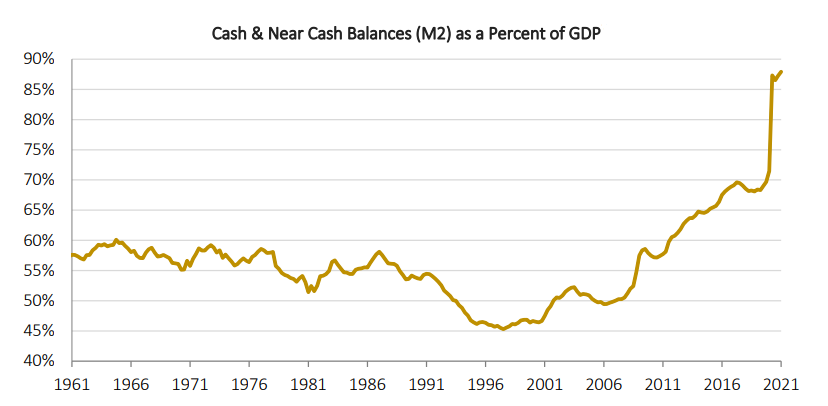
Admittedly, yields on ten-year US Treasury bonds increased by 5 percentage points over this period. However, looking at today’s situation, with the ten-year treasury at 1.4%, core inflation currently running at 4.5%, onshoring of global supply chains, all-time high cash levels in the economy and what seems like somewhat open-ended monetary and fiscal stimulus, it does not strike us that higher long term interest rates and inflation should be dismissed as a possibility, particularly due to the punishing consequences of being wrong.
Parts of the stock market are not the only place there exists of a consensus of a flawless future. In investment grade bonds, the additional expected yield that an owner receives over a risk-free government bond (also known as the “credit spread”) is near all time lows. In the high yield market, we have all time low levels of yield, at a paltry 3.7%5. Dipping down in credit quality does not solve the dilemma, as CCC-rated bonds, at a meagre 5.5%6, yield a full percentage point less than they have at anytime in their history prior to 2020.
The Good News is That Attractive Investments Do Still Exist
From a top-down perspective, investment risk appears high. But from a bottom-up perspective, there are still solid investments to be found. It just takes turning over more rocks. We have found select Canadian high yield and listed debt issuers continue to have good risk-reward relationships and we have assembled a collection of relatively short duration high yield bonds that we believe offer between three and five percent return expectations. Issuers such as Parkland Corporation (gas stations), Superior Plus (propane delivery) and Kruger Products (tissue and packaging) are good examples of the defensive, dependable credits we own. These issuers, along with other defensive investments comprise more than 50% of the portfolio and form the core of our below-average exposure to the credit market. Given the solid credit profile of these issuers and the relatively low duration of this segment of the portfolio, we believe these investments will hold up very well, rain or shine.
We also are seeing plenty of corporate actions, which bring with them a variety of attractive prospective investment opportunities. Our recently realized investment in the Shaw Communications Preferred Shares serves as a good example that outsized returns are achievable if one is at the ready to expend focused time to research and efficiently execute the right prospective investment. Further, our opportunistic investment in the convertible bonds of J2 Global in the summer of 2020 continues to bear fruit as the company announced strong earnings and a spinoff transaction which has been exceedingly well-received by equity investors (through which our convertible benefits). Given current wide-open credit conditions and prospective changes to capital gains taxes, we expect corporate activity to heat up and opportunity sets to expand as we proceed through the year.
The Silver Lining of Market Exuberance
Sometimes, certain sector valuations simply go too far. While it is easy to complain about the extreme complacency seen in the credit market, it’s better to do something about it. Today we see a wonderful opportunity to hedge against negative market surprises through the investment grade bond space.
Valuation Risk
Right now, we think the investment grade credit market contains an incredibly optimistic consensus, perhaps stronger than we’ve ever seen before. Pricing is at a level that appears to reflect a valuation overshoot, with the market coasting to ever more expensive levels merely on what we would attribute to the narrative artifact of “the Fed's got our back” that saturated the psyches of investors over the last year and a half. It is worth unpacking what has happened over this time to truly understand that this “Fed Put” should be thought of as irrelevant at current valuations.
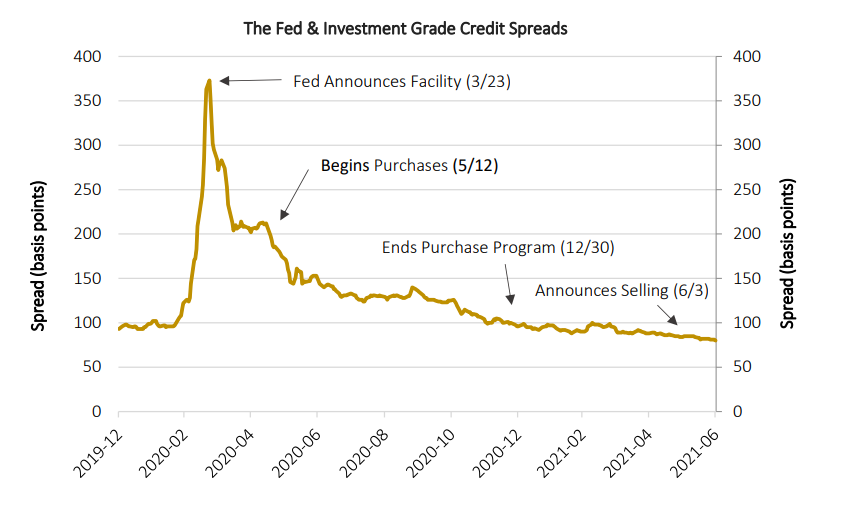
Looking back to the second and third weeks of March 2020, by most appearances one could have concluded there was a run underway on corporate bond markets. And, to solve this issue, one could have presumed that the Federal Reserve really needed to be in the market immediately. As it turns out, the Fed’s mere commitment that it would buy corporate bonds under a large purchase programme was sufficient to turn the market tide. By the time the Fed got its ducks in a row to actually purchase bonds in the market in May of 2020, the market had already rocketed out of its pit of despair. The market move(down and up) was entirely driven by psychology. We find this a remarkable lesson and is a prime demonstration of how fickle markets can be. The Fed Put in investment grade bonds was left effectivelyuntested10 and by the end of 2020, the Fed quietly ended purchases under its facility. Finally, by June2021, in an apparent response to very frothy market conditions, the Fed actually made a surprise announcement of unwinding the facility. Based on the fact that the Fed is a seller of corporate securities, it would be a stretch to expect the Fed Put to return to the corporate market anytime before the next crisis, In the absence of this technical support, valuation risk in the investment grade market is clearly high.
Fundamental Risk
Current fundamental risk in investment grade is also at the highest level ever seen in history. From a credit perspective, the share of BBB rated debt has expanded from 20% to more than 50% over the last20 years. Interest rate risk has increased by more than 50% as well over this same time period with duration expanding from 5.5 to 8.25 years. Based on current balance sheets (leverage/credit risk) and security attributes (interest rate risk), the market has more risk in it than ever. Prospective fundamental risk is high and increasing as well. What do you get when you combine near record-low costs of debt, record high stock market valuations, an expanding economy and CEO confidence at the highest levels since 1983? Our bet is on stock buybacks and debt-fueled M&A activity. These activities are detrimental to creditors.
The Risk-to-Reward Proposition
Following the Great Financial Crisis, we have seen four instances of material credit market weakness, as measured by increases in credit spreads.
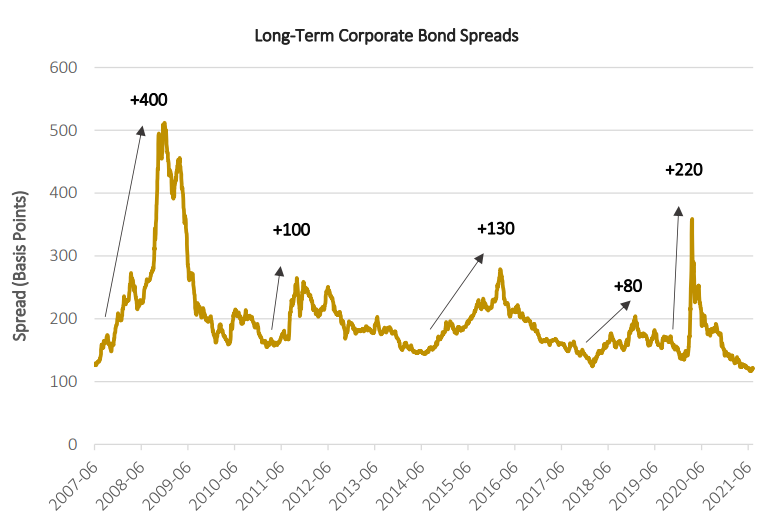
During these periods of credit spread widening, corporate bonds fall in price relative to government bonds. This effect is magnified particularly in long-term (30-40 year) corporate bonds. Excluding the Great Financial Crisis, in the long-term corporate bond sector we have seen credit spread widening of anywhere from 0.8% to 2.2% during these periods of weakness. Due to the fact that long-term bond prices are exceptionally sensitive to changes in credit spreads combined with credit spreads being at multi-decade lows, investment risk appears to be at peak levels in this space. If spreads widen, watch out.
What the Bond Math Tells Us
Let’s take Verizon Communications’ 3% Notes due 2060 for example. This bond has a yield that is 1.25% higher than its like-maturity US Treasury bond. If this 1.25% spread increases by one percentage point to a 2.25% spread, it results in a price decline of 19% in the Verizon long bond. Given we’ve seen increases of more than 1% in long corporate bond spreads on three occasions in the last ten years, it could be argued that a widening of more than one percentage point from current levels is a very reasonable potential outcome.
The Reward-to-Risk in Numbers
When we compare the potential payoff of 19%, we can see how attractive this payoff structure is in the context of its carrying cost. Shorting Verizon’s bond versus owning a similar maturity Treasury bond has a potential payoff of 19% relative to a very modest 1.25% carrying cost (plus modest borrow fees). This investment offers an approximate 15:1 relationship of potential return versus its annual carrying cost. This highly favorable payoff structure also means the position doesn’t require great market timing, since the carrying costs are so low. Finally, if there were to be a more significant seizure in financial markets like we saw in early 2020, where credit spreads widened by more than 2%, this payoff would improve to34%, a payoff that nearly equals the drawdown seen in the stock market at the time. All this for a mid 1%carrying cost strikes us as a once-in-a-cycle opportunity that is currently presenting itself. This risk/reward relationship reminds us of George Soros’ oft-noted comment which is “it's not whether you're right or wrong, but how much money you make when you're right and how much you lose when you're wrong.” We like the 15:1 payoff on something that has happened (for some reason or another)three times in the last ten years.
Why This Opportunity is Available
So, if this is such a no-brainer, what’s in it for the buyers of these long corporate bonds? In the words of a bulge bracket institutional credit salesperson “nobody is in the long end unless they have to be.” In addition to the Federal Reserve pushing many investors out the risk curve, most long-term investment grade bond buyers are “LDI” (liability driven investment) managers who are focused on managing long dated obligations. These buyers are less concerned with absolute levels of compensation as they are with simply matching cash inflows with outflows far in the future. Asian institutions, specifically, are a major player in this sector of the market and their buying (or selling) is driven typically by how much additional yield they can earn after hedging costs. Right now, a yield advantage exists and hedging costs are very low, but this is likely to change as the Federal Reserve raises interest rates. Suffice it to say that the utility of these bonds are not evergreen in the eyes of this large market constituent.
The Nuts and Bolts of it
A meaningful allocation to investments that benefit from widening long-term corporate bond spreads isn’t particularly commonplace in asset management. To express this view, large funds would have to diversify across hundreds of bonds in order to avoid too much issue concentration risk. This vastly shrinks the number of funds able to execute on this opportunity. In addition, the notion of paying out premium for an indefinite amount of time in exchange for an uncertain (but hopefully outsized) gain is not particularly compatible with the very nature of many investors, particularly those in fixed income. Many investors would prefer to make money 85% of the time regardless of the consequences of the other 15% of the time. This lumpiness in the return profile is a contributing factor in why this type of investment is undervalued in the first place.
Déjà Vu in the Ewing Morris Fixed Income Department
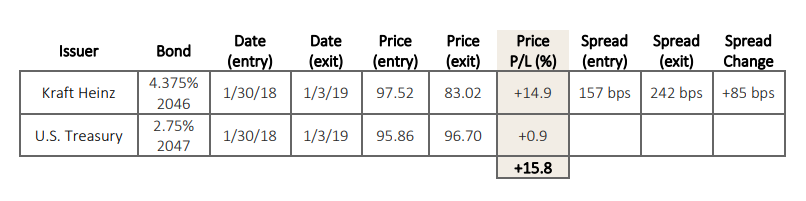
It should be noted that we’ve executed on this investment before. In early 2018 we identified an excellent backdrop in the consumer packaged food space to take advantage of a similar setup. The investment thesis was communicated in our 2017 annual letter, reviewed in our 2018 performance report card and was later noted in Bloomberg. Below is portfolio activity from a sample bond from this basket. Kraft Heinz credit spreads widened by 0.85% from their all-time tights, which produced a 16%price profit from the short position versus a long US Treasury. Subtracting a years’ worth of carry (spread+ borrow cost) from the investment resulted in a total return of about 14% for the position. Today we are pleased to see this opportunity available across the entire sector.
Our Perspective on Today’s Market
Markets tend to be uncomfortable places at times of unusual levels of valuation, but they don’t have to be. As the investments we have made contain a comfortable gap between price and value and our hedges have been well-set, we are moving forward with confidence in a market that should warrant plenty of caution.
Thank you for your investment in the Ewing Morris Flexible Fixed Income Fund.
1Coinmarketcap.com
2US Nominal GDP - Federal Reserve Economic Database (FRED)
3Using the GDP Implicit Price Deflator - FRED - Series: USAGDPDEFQISMEI
4Bloomberg, FRED
Inception date of the Flexible Fixed Income Fund is February 1, 2016. Flexible Fixed Income Fund returns reflect ClassP - Master Series, net of fees and expenses. We have listed the iShares U.S. High Yield Bond Index ETF (CAD-Hedged)and iShares Canadian Corporate Bond Index ETF as benchmark indices as these are widely known and usedbenchmark indices for fixed income markets. The Fund has a flexible investment mandate and thus these benchmarkindices are provided for information only. Comparisons to benchmarks and indices have limitations. The Fund doesnot invest in all, or necessarily any, of the securities that compose the referenced benchmark indices, and the Fundportfolio may contain, among other things, options, short positions and other securities, concentrated levels ofsecurities and may employ leverage not found in these indices. As a result, no market indices are directly comparableto the results of the Fund. Past performance does not guarantee future returns. This letter does not constitute anoffer to sell units of any Ewing Morris Fund, collectively, “Ewing Morris Funds”. Units of Ewing Morris Funds are onlyavailable to investors who meet investor suitability and sophistication requirements. While information prepared inthis report is believed to be accurate, Ewing Morris & Co. Investment Partners Ltd. makes no warranty as to thecompleteness or accuracy nor can it accept responsibility for errors in the report. This report is not intended for publicuse or distribution. There can be no guarantee that any projection, forecast or opinion will be realized. All informationprovided is for informational purposes only and should not be construed as personal investment advice. Users ofthese materials are advised to conduct their own analysis prior to making any investment decision. Source: CapitalIQ, Bloomberg and Ewing Morris. As of June 30, 2021.
Dear Friends and Partners,
In the first half of 2021, the Flexible Fixed Income Fund returned +6.3%. Since the Fund’s inception in early 2016, it has delivered a compound annual return of +7.4%.
2021 has been a period of differentiation for the fund. Despite having low net exposure relative to its history, the Fund has produced returns meaningfully in excess of its benchmarks. This is owing to our continued application of the Fund’s flexible investment strategy, owning a narrow collection of favorable ideas across the credit spectrum. With the exception of glaring sector-wide pricing distortions, which we take periodic advantage of, we continue to be focused on opportunities at the micro-level. Individual opportunities and portfolio composition may vary in security type - secured, unsecured, convertible, preferred – but our focus on risk adjusted returns remains the same.
Ewing Morris Flexible Fixed Income Fund LP returns reflect Class P - Master Series, net of fees and expenses. Inception date of the Fund is February 1, 2016. U.S. High Yield Bonds are represented by the iShares U.S. High Yield Bond Index ETF (CAD-Hedged). Canadian Investment Grade Bonds are represented by the iShares Canadian Corporate Bond Index ETF.
2021: A Year of Many Firsts
To say that 2021 is an unusual year is like saying that Warren Buffett or Mark Leonard is an above average investor (a massive understatement, to be clear). This year has been host to a wide variety of phenomena that make this part of the cycle as exciting and entertaining as they are foreboding:
Former US Treasury Secretary Larry Summers remarked this month:
"We're driving our car at 100 miles an hour on a road that is empty right now but won't always be empty and I don't know what form the accident will come, but when you're driving 100 miles an hour it's probably not actually the fastest way to get where you're going because you're likely to have some kind of dislocation."
As the Federal Reserve begins to consider winding down its record stimulus programs, this perspective lands quite well. In the meantime, we continue to marvel at a situation where monetary and fiscal stimulus have combined to fuel a spectacular inflation of nearly all financial assets. “Stimmy checks” sent to many Americans have contributed to a replay reminiscent of the dot-com bubble, where retail investors are back to being a prominent feature of the market, causing massive distortions in certain areas of markets. What is different this time around is that social media has proven to be a potent accelerant, encouraging "YOLO" (you only live once) and "FOMO" (fear of missing out) behaviour in many assets including:
"Meme investments" such as Gamestop and Dogecoin. Gamestop equity saw a 17-fold increase in the month of January. Dogecoin, a cryptocurrency that was originally made as a joke, saw a 52-fold year-to-date rally by May to reach a peak aggregate market value of 89 billion dollars.1
Bitcoin. The apparent posterchild of the Bitcoin craze is Michael Saylor. Saylor is the CEO of a multibillion dollar publicly traded, software-turned-bitcoin-holding company and in June told investors “once you know how it all ends, the only use of time is, ‘How do I buy more Bitcoin?’ Take all your money, buy Bitcoin…. and if you absolutely love the thing that you don't want to sell, go mortgage your house and buy bitcoin with it and if you've got a business that you love because your family works for the business, it's in your family for 37 years and you can't bear to sell it, mortgage it and convert the proceeds into the hardest money on earth which is bitcoin.”
Finally, we are seeing other things like a single-location deli in New Jersey that generated only fourteen thousand dollars in sales in 2020 that somehow saw a two billion dollar valuation. For those looking to get rich quick by merging a frozen banana stand into a SPAC, this has been the year to do it.
High Expectations
All of these anecdotes bring to life just how untethered from reality securities prices can get. By many measures, equity and credit markets are pricing in the smoothest of future conditions. The economy will grow. The Federal Reserve will deftly taper and normalize interest rates. Inflation will moderate. Geopolitical conflicts will cool. These are the types of assumptions that seem embedded in the market consensus, for now.
Just as Jeff Bezos has remarked “the stock is not the company and the company is not the stock”, the same can be said about the economy and financial markets. It is intuitive that the performance of these two entities should have a relatively tight relationship, but this isn’t always the case. History demonstrates that even when we have seen excellent economic growth, it is actually far from certain that financial markets will closely match these outcomes. It would probably strike most people as impossible that we could see a flat stock market amidst an economic expansion of 300%2, but that is precisely what happened in the United States from early 1966 to late 1982. This fact of history bears repeating. Over a period lasting nearly 17 years, the Dow Jones Industrial Average Index (DJIA) saw essentially no gain in price while the economy expanded by approximately 320 percent. If we adjust both indices similarly for inflation3 the result is equally staggering: the DJIA declined by 66 percent in real terms while the economy expanded by 54%4. In retrospect, it was not particularly surprising to see in 1977 Warren Buffett write in Fortune explaining to the investing public “How Inflation Swindles the Equity Investor.” The economy is not the market indeed.
Admittedly, yields on ten-year US Treasury bonds increased by 5 percentage points over this period. However, looking at today’s situation, with the ten-year treasury at 1.4%, core inflation currently running at 4.5%, onshoring of global supply chains, all-time high cash levels in the economy and what seems like somewhat open-ended monetary and fiscal stimulus, it does not strike us that higher long term interest rates and inflation should be dismissed as a possibility, particularly due to the punishing consequences of being wrong.
Parts of the stock market are not the only place there exists of a consensus of a flawless future. In investment grade bonds, the additional expected yield that an owner receives over a risk-free government bond (also known as the “credit spread”) is near all time lows. In the high yield market, we have all time low levels of yield, at a paltry 3.7%5. Dipping down in credit quality does not solve the dilemma, as CCC-rated bonds, at a meagre 5.5%6, yield a full percentage point less than they have at anytime in their history prior to 2020.
The Good News is That Attractive Investments Do Still Exist
From a top-down perspective, investment risk appears high. But from a bottom-up perspective, there are still solid investments to be found. It just takes turning over more rocks. We have found select Canadian high yield and listed debt issuers continue to have good risk-reward relationships and we have assembled a collection of relatively short duration high yield bonds that we believe offer between three and five percent return expectations. Issuers such as Parkland Corporation (gas stations), Superior Plus (propane delivery) and Kruger Products (tissue and packaging) are good examples of the defensive, dependable credits we own. These issuers, along with other defensive investments comprise more than 50% of the portfolio and form the core of our below-average exposure to the credit market. Given the solid credit profile of these issuers and the relatively low duration of this segment of the portfolio, we believe these investments will hold up very well, rain or shine.
We also are seeing plenty of corporate actions, which bring with them a variety of attractive prospective investment opportunities. Our recently realized investment in the Shaw Communications Preferred Shares serves as a good example that outsized returns are achievable if one is at the ready to expend focused time to research and efficiently execute the right prospective investment. Further, our opportunistic investment in the convertible bonds of J2 Global in the summer of 2020 continues to bear fruit as the company announced strong earnings and a spinoff transaction which has been exceedingly well-received by equity investors (through which our convertible benefits). Given current wide-open credit conditions and prospective changes to capital gains taxes, we expect corporate activity to heat up and opportunity sets to expand as we proceed through the year.
The Silver Lining of Market Exuberance
Sometimes, certain sector valuations simply go too far. While it is easy to complain about the extreme complacency seen in the credit market, it’s better to do something about it. Today we see a wonderful opportunity to hedge against negative market surprises through the investment grade bond space.
Valuation Risk
Right now, we think the investment grade credit market contains an incredibly optimistic consensus, perhaps stronger than we’ve ever seen before. Pricing is at a level that appears to reflect a valuation overshoot, with the market coasting to ever more expensive levels merely on what we would attribute to the narrative artifact of “the Fed's got our back” that saturated the psyches of investors over the last year and a half. It is worth unpacking what has happened over this time to truly understand that this “Fed Put” should be thought of as irrelevant at current valuations.
Looking back to the second and third weeks of March 2020, by most appearances one could have concluded there was a run underway on corporate bond markets. And, to solve this issue, one could have presumed that the Federal Reserve really needed to be in the market immediately. As it turns out, the Fed’s mere commitment that it would buy corporate bonds under a large purchase programme was sufficient to turn the market tide. By the time the Fed got its ducks in a row to actually purchase bonds in the market in May of 2020, the market had already rocketed out of its pit of despair. The market move(down and up) was entirely driven by psychology. We find this a remarkable lesson and is a prime demonstration of how fickle markets can be. The Fed Put in investment grade bonds was left effectivelyuntested10 and by the end of 2020, the Fed quietly ended purchases under its facility. Finally, by June2021, in an apparent response to very frothy market conditions, the Fed actually made a surprise announcement of unwinding the facility. Based on the fact that the Fed is a seller of corporate securities, it would be a stretch to expect the Fed Put to return to the corporate market anytime before the next crisis, In the absence of this technical support, valuation risk in the investment grade market is clearly high.
Fundamental Risk
Current fundamental risk in investment grade is also at the highest level ever seen in history. From a credit perspective, the share of BBB rated debt has expanded from 20% to more than 50% over the last20 years. Interest rate risk has increased by more than 50% as well over this same time period with duration expanding from 5.5 to 8.25 years. Based on current balance sheets (leverage/credit risk) and security attributes (interest rate risk), the market has more risk in it than ever. Prospective fundamental risk is high and increasing as well. What do you get when you combine near record-low costs of debt, record high stock market valuations, an expanding economy and CEO confidence at the highest levels since 1983? Our bet is on stock buybacks and debt-fueled M&A activity. These activities are detrimental to creditors.
The Risk-to-Reward Proposition
Following the Great Financial Crisis, we have seen four instances of material credit market weakness, as measured by increases in credit spreads.
During these periods of credit spread widening, corporate bonds fall in price relative to government bonds. This effect is magnified particularly in long-term (30-40 year) corporate bonds. Excluding the Great Financial Crisis, in the long-term corporate bond sector we have seen credit spread widening of anywhere from 0.8% to 2.2% during these periods of weakness. Due to the fact that long-term bond prices are exceptionally sensitive to changes in credit spreads combined with credit spreads being at multi-decade lows, investment risk appears to be at peak levels in this space. If spreads widen, watch out.
What the Bond Math Tells Us
Let’s take Verizon Communications’ 3% Notes due 2060 for example. This bond has a yield that is 1.25% higher than its like-maturity US Treasury bond. If this 1.25% spread increases by one percentage point to a 2.25% spread, it results in a price decline of 19% in the Verizon long bond. Given we’ve seen increases of more than 1% in long corporate bond spreads on three occasions in the last ten years, it could be argued that a widening of more than one percentage point from current levels is a very reasonable potential outcome.
The Reward-to-Risk in Numbers
When we compare the potential payoff of 19%, we can see how attractive this payoff structure is in the context of its carrying cost. Shorting Verizon’s bond versus owning a similar maturity Treasury bond has a potential payoff of 19% relative to a very modest 1.25% carrying cost (plus modest borrow fees). This investment offers an approximate 15:1 relationship of potential return versus its annual carrying cost. This highly favorable payoff structure also means the position doesn’t require great market timing, since the carrying costs are so low. Finally, if there were to be a more significant seizure in financial markets like we saw in early 2020, where credit spreads widened by more than 2%, this payoff would improve to34%, a payoff that nearly equals the drawdown seen in the stock market at the time. All this for a mid 1%carrying cost strikes us as a once-in-a-cycle opportunity that is currently presenting itself. This risk/reward relationship reminds us of George Soros’ oft-noted comment which is “it's not whether you're right or wrong, but how much money you make when you're right and how much you lose when you're wrong.” We like the 15:1 payoff on something that has happened (for some reason or another)three times in the last ten years.
Why This Opportunity is Available
So, if this is such a no-brainer, what’s in it for the buyers of these long corporate bonds? In the words of a bulge bracket institutional credit salesperson “nobody is in the long end unless they have to be.” In addition to the Federal Reserve pushing many investors out the risk curve, most long-term investment grade bond buyers are “LDI” (liability driven investment) managers who are focused on managing long dated obligations. These buyers are less concerned with absolute levels of compensation as they are with simply matching cash inflows with outflows far in the future. Asian institutions, specifically, are a major player in this sector of the market and their buying (or selling) is driven typically by how much additional yield they can earn after hedging costs. Right now, a yield advantage exists and hedging costs are very low, but this is likely to change as the Federal Reserve raises interest rates. Suffice it to say that the utility of these bonds are not evergreen in the eyes of this large market constituent.
The Nuts and Bolts of it
A meaningful allocation to investments that benefit from widening long-term corporate bond spreads isn’t particularly commonplace in asset management. To express this view, large funds would have to diversify across hundreds of bonds in order to avoid too much issue concentration risk. This vastly shrinks the number of funds able to execute on this opportunity. In addition, the notion of paying out premium for an indefinite amount of time in exchange for an uncertain (but hopefully outsized) gain is not particularly compatible with the very nature of many investors, particularly those in fixed income. Many investors would prefer to make money 85% of the time regardless of the consequences of the other 15% of the time. This lumpiness in the return profile is a contributing factor in why this type of investment is undervalued in the first place.
Déjà Vu in the Ewing Morris Fixed Income Department
It should be noted that we’ve executed on this investment before. In early 2018 we identified an excellent backdrop in the consumer packaged food space to take advantage of a similar setup. The investment thesis was communicated in our 2017 annual letter, reviewed in our 2018 performance report card and was later noted in Bloomberg. Below is portfolio activity from a sample bond from this basket. Kraft Heinz credit spreads widened by 0.85% from their all-time tights, which produced a 16%price profit from the short position versus a long US Treasury. Subtracting a years’ worth of carry (spread+ borrow cost) from the investment resulted in a total return of about 14% for the position. Today we are pleased to see this opportunity available across the entire sector.
Our Perspective on Today’s Market
Markets tend to be uncomfortable places at times of unusual levels of valuation, but they don’t have to be. As the investments we have made contain a comfortable gap between price and value and our hedges have been well-set, we are moving forward with confidence in a market that should warrant plenty of caution.
Thank you for your investment in the Ewing Morris Flexible Fixed Income Fund.
1Coinmarketcap.com
2US Nominal GDP - Federal Reserve Economic Database (FRED)
3Using the GDP Implicit Price Deflator - FRED - Series: USAGDPDEFQISMEI
4Bloomberg, FRED
Inception date of the Flexible Fixed Income Fund is February 1, 2016. Flexible Fixed Income Fund returns reflect ClassP - Master Series, net of fees and expenses. We have listed the iShares U.S. High Yield Bond Index ETF (CAD-Hedged)and iShares Canadian Corporate Bond Index ETF as benchmark indices as these are widely known and usedbenchmark indices for fixed income markets. The Fund has a flexible investment mandate and thus these benchmarkindices are provided for information only. Comparisons to benchmarks and indices have limitations. The Fund doesnot invest in all, or necessarily any, of the securities that compose the referenced benchmark indices, and the Fundportfolio may contain, among other things, options, short positions and other securities, concentrated levels ofsecurities and may employ leverage not found in these indices. As a result, no market indices are directly comparableto the results of the Fund. Past performance does not guarantee future returns. This letter does not constitute anoffer to sell units of any Ewing Morris Fund, collectively, “Ewing Morris Funds”. Units of Ewing Morris Funds are onlyavailable to investors who meet investor suitability and sophistication requirements. While information prepared inthis report is believed to be accurate, Ewing Morris & Co. Investment Partners Ltd. makes no warranty as to thecompleteness or accuracy nor can it accept responsibility for errors in the report. This report is not intended for publicuse or distribution. There can be no guarantee that any projection, forecast or opinion will be realized. All informationprovided is for informational purposes only and should not be construed as personal investment advice. Users ofthese materials are advised to conduct their own analysis prior to making any investment decision. Source: CapitalIQ, Bloomberg and Ewing Morris. As of June 30, 2021.

2021 Annual Letter
To the Limited Partners of the Ewing Morris Flexible Fixed Income Fund:
In 2021, the Flexible Fixed Income Fund Returned 8.3%. Since the Fund’s inception in early 2016, it has delivered a compound annual return of 7.1%.
This return compares to our long-term return expectations of 5% to 7% and our publicly traded high yield and investment grade benchmarks, which in 2021 returned +3.6% and -1.8%, respectively. 2021 was a very solid year for the Fund; overall, there were many sources that drove returns in the Fund, with the unifying theme being idea-specific value add, which was punctuated in a handful of positions producing outsized results in the year. In addition, contributions came from both long and short positions, as was well-evidenced by the Fund’s positive performance in November, when credit and equity markets saw a notable correction on the back of the Omicron variant’s proliferation.
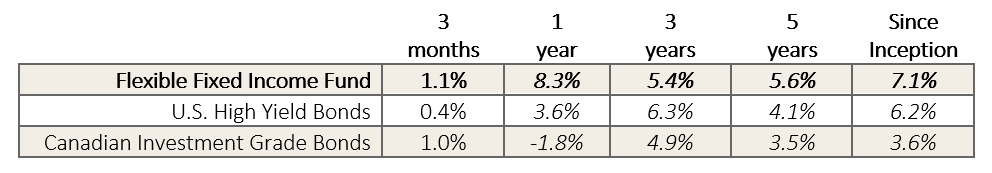
Performance reflects Class P- Master Series, net of fees and expenses. Inception date of the Fund is February 1, 2016. U.S. High Yield Bonds are represented by the iShares U.S. High Yield Bond Index ETF (CAD-Hedged). Canadian Investment Grade Bonds are represented by the iShares Canadian Corporate Bond Index ETF.
The largest contributors to performance in 2021 were our investments in securities of Ziff Davis and Shaw Communications.
Since the mid-summer of 2020, we have owned a conviction-sized position in the convertible bonds of Ziff Davis (formerly known as J2 Global). Ziff Davis has been a staple of our equity strategies and one of the top-performing underlying businesses that we own at Ewing Morris. As we have been well-acquainted with the company, we were able to take full advantage in mid-2020, when an opportunity arose to enter the company’s convertible bonds at a record discount to par (the bonds traded as low as 77 cents on the dollar). Throughout 2020 and 2021, Ziff Davis has grown its earnings ahead of street and investor expectations by a wide margin, benefiting its convertible bonds which over the last year, has traded from a 103 dollar price to end the year at 122. Currently, the company is growing revenue organically in the low teens and, net of its cash and investments, has effectively no debt. In addition to its strong growth profile, the quality of the company’s earnings is excellent; Ziff Davis expects to convert 60% of its EBITDA into free cash flow. Despite these excellent attributes, Ziff Davis trades for less than 10x EBITDA. Similar digital media businesses frequently fetch multiples exceeding 15x. In our view, the investment opportunity in Ziff Davis’ bond is excellent, and what we like most is the location of the strike price of the security: $107. With the stock itself around this same price, the bonds would participate in the upside potential of the stock, yet the bonds ultimately have limited downside to par at its 2026 maturity.
In the case of Shaw Communications, we took advantage of purchasing the company’s Class 2 Preferred Shares in March, following the announcement that Rogers Communications had agreed to buy Shaw. We built our position over the first three days following the announcement. Our success with this investment was a function of several things. First, we had a solid familiarity with similar precedent transactions of this kind. A similar situation that immediately came to mind was Lowe’s acquisition of Rona, where we successfully monetized Rona’s preferred shares in the context of that deal in 2016. Second, our fund’s relatively nimble size allowed us to attain our desired position size quickly. Third, our ability to glean insight into the legal structuring and funding nuances of the transaction allowed us to conclude that there was a high likelihood that Shaw’s preferred share issue would be redeemed at its optional June redemption date at a price 25% higher than the price at which we were able to accumulate our position in March. What we liked best about the situation is that the thesis did not actually rely on the greater corporate transaction closing. We will continue to look at opportunities such as these when they arise in the Canadian preferred space as we are continually surprised to see marked deviations between price and value in relation to corporate transactions.
Everybody’s Talking About Inflation: Not a Friendly Investment Character
Inflation is the principal macro-level risk we see in today’s pricey fixed income market. While speculation about future inflation is fraught with error, there is high investment risk associated with a complacent view at today’s level of interest rates. Our thinking is that, contrary to central bankers’ public narrative, inflation has a risk of becoming less anchored than most would like. This is a concern because we are observing whole markets of fixed income securities - mainly securities residing in the investment grade space - that we expect to realize guaranteed losses of purchasing power over their investment life.
Our risk assessment is informed by both valuation risk and fundamental risk. From a valuation perspective, it is easy to make an argument that a 2% rate on a 30 year US Treasury bond does not adequately compensate investors when monetary policy itself seeks to achieve a 2% inflation rate.
From a fundamental perspective, there are some very deep-rooted inflationary factors emerging. Declining international trust and consumer expectations for inflation are two factors we see that are among the most important.
Lower Trust = Higher Inflation
It turns out that changes in trust between nations produce economic consequences. Increasing trust is deflationary and decreasing trust is inflationary. The reason for this is that trust is a prerequisite for ongoing trading relationships. If trust between countries declines sufficiently, the countries will eventually look to in-source the goods or services they are seeking. The production of formerly imported goods or services are brought back into countries that are not best suited to produce them and thus have higher costs of production. This simple change is quite obviously inflationary. Furthermore, history tells us the tides of geopolitical trust are measured in decades and not in years. We would not define a multi-decade dynamic as “transitory.” The reality is that the deflationary effects of globalization we have enjoyed for decades are indeed reversing. For example, in the semiconductor space, for the first time in more than two decades, TSMC is building a fabrication plant in the US at the cost of 12 billion dollars. In late 2020, China officially put a blockade on coal from Australia, relying on higher cost supply from its own domestic production and other trading partners. This is not a dynamic we expect to show up in inflation numbers in the short term, but this is the type of inflation that interest rate hikes may not be able to moderate.
Higher Consumer Inflation Expectations = Higher Inflation
A very pernicious driver of inflation is the mere expectation of higher inflation. For this reason, it’s not a surprise to us that the Federal Reserve downplayed inflation effects as “transitory,” given that there’s no upside in setting persistently higher inflation expectations. The canaries in the inflation expectation coal mine are “cost-of-living-adjustments” embedded in labor contracts. These COLA provisions contribute to a “wage-price spiral” and durable inflation. And we are seeing COLAs take root once again. In November 10,000 union workers at John Deere successfully negotiated quarterly inflation adjustments in addition to a 10% raise, two 5% raises and two large bonuses through 2026. Unionized employees at Kellogg also recently ratified a labor contract with COLA provisions. Finally, in a thoroughly ironic development, central bank staff are arguing for more pay based on inflation as a Bloomberg headline recently read: “ECB Staff Union Demands More Pay to Guard Against Inflation.” Developments like these may be hair raising for central bankers and fixed income investors alike.
What Inflation Means for “Low-Risk” Investment Strategies
A principal goal of our approach is to minimize the risk of permanent loss (what we consider to be true investment risk) and control volatility. We would posit that “permanent loss” can also be considered “permanent loss of purchasing power,” a concept that takes into account the impact of inflation on capital. Even at Central Banks’ long-term expectations for inflation, one dollar today needs to grow by about 2% on an after-tax basis to avoid loss of purchasing power. From this perspective, it can be understood that long term allocations to cash or investment grade securities effectively ensures permanent loss of purchasing power. Even at a 2% rate of inflation, a five-year holding period would result in an approximate 10% impairment on cash relative to the future cost of living. Our view is that higher yielding fixed income investments and strategies that carry low-risk, mid-to-high single digit returns are one of the few conservative means of minimizing loss of purchasing power while also maintaining potential for accumulation of substantial real returns over the long term.
Our Approach in the Current Situation
The challenges that confront us are clear: inflation running well-ahead of prevailing interest rates, and we see elevated valuations in risk markets. There are no obvious traditional solutions to these challenges but due to our flexible, unconstrained approach, we see avenues to thrive in this market context.
With excesses, bring opportunity and we are taking advantage of several dynamics.
First, an important investment dynamic that arises from such easy credit conditions is plenty of corporate actions - mergers and acquisitions being the most common form. These events tend to have important consequences for the pricing of corporate debt securities of all companies involved and we seek to identify and monetize the sources of “Structural Value” in securities involved with or prospectively exposed to corporate actions. We have seen M&A activity at a record pace in 2021 and as of this writing, the conditions for this continue.
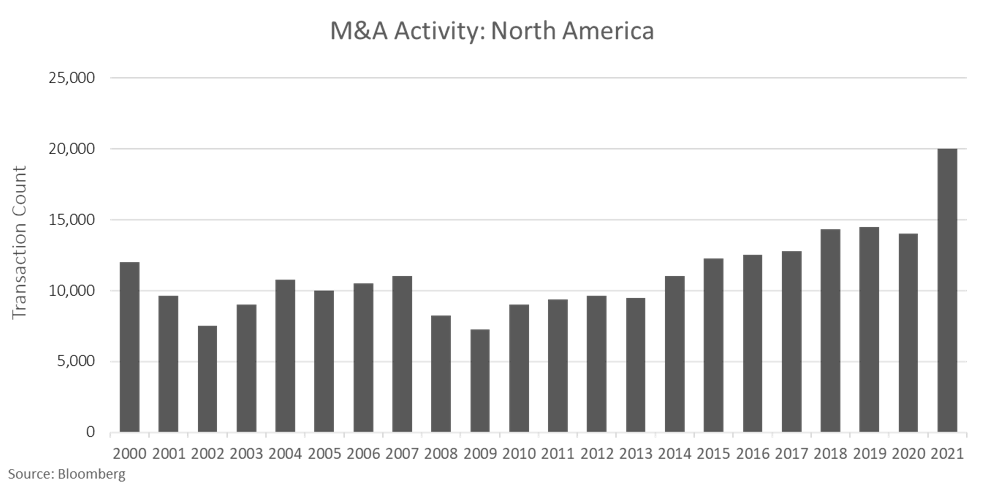
The reason why Structural Value investments are appealing to us is because bond investors typically focus on traditional drivers of credit pricing such as a company’s financial condition, cash flow characteristics, leverage, management’s capital strategy and the term structure of a given debt security. Often, that is where the analysis ends. However, there are special circumstances where value in a debt investment is ultimately driven by dynamics that reside outside of these conventional models for credit pricing. Investments in securities with Structural Value have different, often hidden, drivers of returns. The most common structural sources of value can be found in a bond's covenant structure, its call (refinancing) structure and its capital or corporate structure positioning. Looking carefully at the subtle aspects unique to the structure of each debt security can uncover exceptional, unrecognized value; value which typically becomes recognized by the market within foreseeable time horizons and most often in connection to capital market activity and corporate actions. This year’s investment in Shaw Communications was an excellent example of this. Approximately 40% of the portfolio is invested in the “Structural Value” category, which dramatically reduces the Fund’s exposure to interest rates and inflation.
Second, we are starting find excellent value in two parts of the market that feature high quality credits with low dollar price bonds. These two areas are BB rated traditional high yield bonds that were issued in mid 2021 and “busted” convertible bonds that were issued mostly in 2020 and 2021. In the case of the traditional high yield bond opportunity set, the BB high yield bond market saw a low in yield of just under 2.8% last year. It is not a surprise that many companies were issuing high yield bonds at these extremely low costs of capital. Since then, we’ve seen a meaningful increase in interest rates, which has taken the prices of these bonds down into the 90’s or even the 80’s. Given many of these BB-rated issuer’s credit condition is largely unchanged, the bonds offer better value than they did before. In the US convertible bond arena, we’re seeing scores of bond issues trading in the 80’s and lower, but the driver of the declines in this space are different. Most of these convertible bonds were issued in the last two years and we have seen the optionality of the convertible bond vanish as the price of the stock underlying the bonds have declined dramatically. What is most interesting, however, is that many of these issuers have high quality underlying businesses and their declining stock prices were a simple recalibration of unrealistic market expectations that we saw assigned to high quality growth stories; similar to the BB space described earlier, the credit quality of many of these businesses hasn’t changed either, yet valuation has improved. The fly in the ointment of these emerging areas of opportunity, however, is that the yields of these securities are still generally modest. However, we believe an underappreciated quality of the securities is the Structural Value angle where bonds that are priced with large discounts to par now carry hidden option value. Namely, through the “change of control” covenant found in high yield bonds and the “fundamental change” covenant found in convertible bonds. These covenants can easily introduce nice overnight surprises of 10-25 percent, as a result of a company takeover. By selecting bonds in safe credits that have takeout optionality, the 4-5% yield we may be harvesting can turn into substantially more. An active M&A environment is exactly one that increases the option value of covenants like these, and that is the environment that we find ourselves in currently. To see evidence of this emerging dynamic in the market we need to look no further than this week’s announcement of Take-Two Interactive’s move to merge with Zynga. Zynga has convertible bonds trading around 90 cents on the dollar, which promptly moved up 10 points on the news on account of the bond’s Fundamental Change covenant. This option value is demonstrably real and we will seek to monetize it in 2022.
Third, as a consequence of the central bank intervention, the market remains awash with capital and distortions remain in credit, particularly in the long-dated investment grade market. We have communicated about the dynamics of this in past letters, and we have acted with conviction to take advantage of historically low long-term corporate bond credit spreads. It is with reasonable frequency that the corporate credit market sees large increases in credit spreads, comfortably averaging more than one percent in magnitude. It is difficult to predict exactly when, but widenings like these have happened in four out of the last ten years - a 40% “base rate.” Given the very long duration of these investments, corporate bonds can generally be expected to drop about 20% in price in an such a circumstance . Currently long-dated credit spreads are about 1.3%, meaning that if things don’t go wrong, investors can expect to bag an extra 1.3% for taking that bond’s credit risk. But if the environment changes as it has in the past, losses of 20% or more could be the base case. To us, it does not take much number crunching to figure the risk reward in this sector is so bad that it is worth betting against. And that’s what we have done. In our view, the hedge substantially reduces the Fund’s overall risk to market shocks, while also carrying a positive expected return over its holding period. However, we would offer a word on expectations: it is useful to note that while our hedges in investment grade should provide excellent protection for the portfolio over time , the tracking of the hedge against our long positions in non-crisis market backdrops may see some deviation. History tells us that this deviation could easily be measured in months, so evaluation of this hedge’s effectiveness is best measured over quarters rather than over shorter time periods.
Outlook
The market is entering the new year much the way it entered 2021: with a 4.3% yield and a lot of capital markets activity. We are most excited about the latter as corporate transactions create opportunities for us to bring our skills to the table, identifying mispriced securities in the context of announced or prospective corporate transactions and creating upside optionality in discounted bonds of high-quality issuers.
We can see markets fluctuating against a more delicate narrative, where concerns of inflation, continued economic threats from the pandemic and geopolitical tensions are colliding with artificially low rates and expensive valuations in risk markets. Given this dynamic, it wouldn’t be a surprise to us to see a volatile year ahead. Despite this, given the portfolio’s position and opportunity set, we look forward to what this year has to bring.
Thank you for your investment in the Ewing Morris Flexible Fixed Income Fund.

Schedule a
Conversation


Connect with Peers


Explore Our Full Library


Library


Minimizing Tax Drag (Part 2)