Fellow Limited Partners,
In 2025, your Select Credit Fund Returned +5.7%. This return compares to our publicly traded high yield benchmark, which returned +6.3%.
Since its inception in May of 2020, the Fund has delivered a compound annual return of 9.2%, net of all fees.
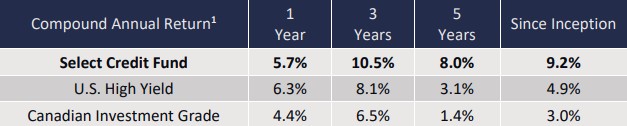
1. Ewing Morris Select Credit Fund LP returns reflect Class P - Master Series, net of fees and expenses as of December 31, 2025. Inception date of the strategy is April 29, 2020. See further description in disclaimer. U.S. High Yield Bonds are represented by the iShares U.S. High Yield Bond Index ETF (CAD-Hedged). Canadian Investment Grade Bonds are represented by the iShares Canadian Corporate Bond Index ETF. See Additional Disclosures. All market-based data sourced from Bloomberg LP.
Performance
For countries, markets and companies, every year has its own features and contours. 2025 was no different. From a market perspective, one striking observation was just how homogenous returns were across fixed income. From top quality investment grade bonds to low quality high yield, realized returns fell generally within a 2% range. Looking at the Fund, our +5.7% absolute return in 2025 was a reasonable outcome, albeit short of our long-term average return. While 2025’s return was under long-term averages, both the history of the strategy as well as concentration of the portfolio itself points to the potential for strong returns albeit being unevenly distributed across time.
Moving into 2026, the portfolio maintains its high focus, with the top three issuers totaling more than 40% as of the year end. The portfolio also features a pocket (less than 20%) of engagement-related equity securities, which is balanced by a significant investment grade spread hedge in the event of any adverse market events.
The Contours of 2025
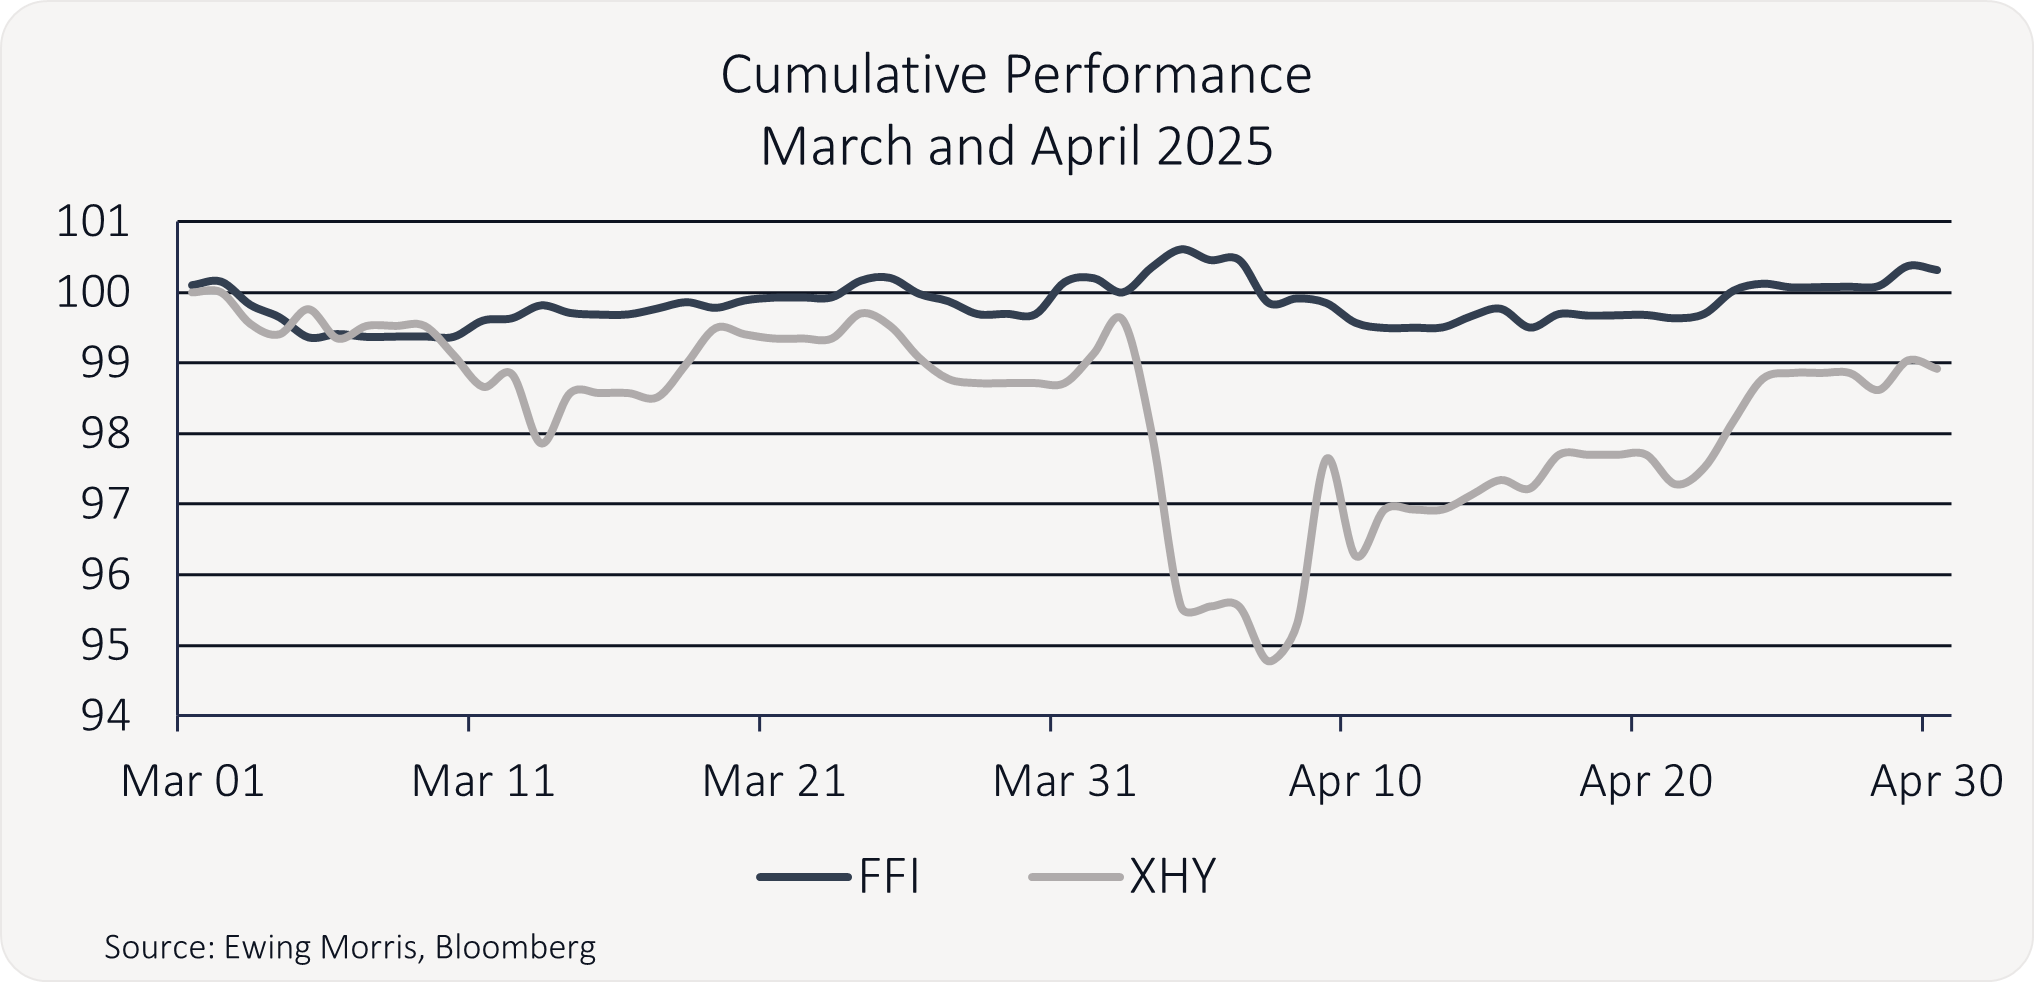
The Trump Tariff Tantrum
In April, the high-yield market sold off sharply following Trump’s stunning opening salvo in global trade negotiations. This was a time when our portfolio risk management shone. Although the market rebounded and ended the month up, we were very pleased with the portfolio’s performance during this tumultuous period and share our intra-month performance with you, which used Bloomberg market pricing. The outperformance in these market down-months was consistent with both our portfolio positioning and our historical performance since inception.
The Power of People
As our study of shareholder engagement and corporate governance deepens, it has become clear to us that companies do not just exist “out there” as operating assets and a collection of contracts. An alternative perspective is that companies can be thought of as deeply social organizations engaged in commercial decision making. And, like any social organization, decision-making authority tends to follow a power-law distribution rather than being evenly spread across the organization, especially in today’s professional director milieu. This fact of life should be exceptionally central to credit investors, because decisions made by one or a few people can alter the trajectory of a credit far more than the gradual movement of the underlying business. This makes the task of determining who these players are and what they want foundational to understanding many credits. It is through the decision making of a few that balance sheets can strengthen, weaken, or transform entirely. On this theme, three examples from the year come to mind.
Larry Ellison - Oracle
Through 2025, one of the Fund’s largest credit short positions was in the long bonds of Oracle at ~5%. These bonds fit well in our long-dated investment grade credit spread hedge basket as Oracle had long demonstrated credit-unfriendly behaviour (tens of billions of share buybacks over time and a five billion-dollar annual dividend, for example). Another attractive feature in Oracle is that transaction costs were low given that the company is among the most liquid long-dated issuers in US investment grade market.
Oracle is unusual in that it is, in large part, controlled by one person: Larry Ellison. Larry is the founder, Chief Technology Officer, and Executive Chair, and he owns 40% of Oracle. This means that what happens to the balance sheet is essentially up to Larry Ellison. In 2025, Larry stepped on the gas, leveraging the company’s balance sheet in pursuit of competitiveness in the AI data center space. At the same time, through his son David, Larry also funded a substantial merger between Skydance and Paramount, with a combined enterprise value of approximately $28Bn, and engaged in a greater than $100Bn bidding war with Netflix over Warner Bros. Discovery.
It is therefore no surprise that Oracle’s credit spreads widened materially in 2025. From the beginning of the year to the time of this writing, Oracle’s 2054 bonds lost approximately 12% in price relative to their benchmark Treasury. A 12% relative price gain versus an approximately 1.2% annual credit spread hedging cost illustrates the asymmetry of the “portfolio insurance” we maintain. With most investment grade credit spreads at or near their lows at other issuers, our portfolio’s hedge has strong prospects of delivering profits in periods of market adversity, should such an environment emerge.
Electronic Arts
A great example of the machinations of social dynamics was found in Electronic Arts (EA). Although we did not own the company’s 2051 bonds, it is a credit case study for the ages that we highlighted on X, which garnered more than 100,000 views. The precise catalyst for the deal is difficult to know from the outside, but a strong argument could be made that the Trump administration’s receptive posture toward the Middle East, combined with newly well-positioned relationships, including Jared Kushner, made a deal possible that may have been impossible for many years. Through the influence and agency of a small number of dynamic individuals, a long-dormant outcome became achievable.
While this deal underlined what is possible through the power of a few people and deep public and private credit markets, it also showed the investment grade corporate bond market something significant. EA’s investment grade–rated bonds due in 2051 traded up from approximately 65 and are now closing in on what appears likely to be 101. This represents roughly a 55 percent price gain on an investment grade–rated bond.
This would also be one of the few times we have seen the prospective takeover premium of the bonds exceed, by more than two times, that of the equity. With this anomalous upside optionality laid bare, we pounced on other safe, long-duration credits that carry similar optionality and continue to find more. Given that there are swathes of investment grade bonds issued in 2021 that now trade at significant discounts, we do not believe that this EA outcome will be an isolated event.
Shawn Sedaghat – TriMas Corporation
TriMas is an industrial conglomerate that had experienced some brushes with activism but had largely been a self-governing company. That changed when a private investor, Shawn Sedaghat, acquired 10% of the company’s stock and joined its board. This was a case in which a single individual appeared to catalyze not only a change in management, but also the sale of the majority of the company’s assets and the creation of a Strategic Investment Committee, all within a year and a half—a truly remarkable achievement.
This case was also instructive because it demonstrated that credit markets often do not respond properly to situations involving shifting balances of power, situations we have experience identifying. In the case of TriMas, after Mr. Sedaghat filed his initial ownership disclosure via a Form 13-D, we took an interest in the situation and began evaluating the various paths the company could take. Several months later, TriMas announced that its CEO would be stepping down. This was a threshold signal to us that meaningful change was possible and that there was now underappreciated upside potential in the bonds. We were among the first in the market to take a meaningful position in the company’s bonds at 91.5 following the leadership news. Fast forward to today, and we are now evaluating a potential asset disposition at par, with the bonds currently trading in the upper 97 range.
Vivek Shah - Ziff Davis Corporation
Ziff Davis is a digital media conglomerate that the public markets have largely written off, with sentiment shaped by the belief that AI has structurally impaired its underlying businesses. That pessimism has driven the equity to trade as low as 3x 2025 EBITDA and, more strikingly, to imply a substantial discount to the company’s sizable cash and investment balance. In effect, the market has assigned a material “capital allocator discount” to Ziff Davis, a condition that CEO Vivek Shah is both responsible for and capable of resolving.
To this end, in November, following inbound interest, the company announced a strategic review. With the equity still trading at a multiple in the mid-3x range, the market continues to bet against the business. Given the strategic review, however, this has effectively become a bet against Vivek Shah and his ability to monetize a collection of durable, cash-flowing platforms that trade substantially below both public comparables and private-market value.
Having invested in three of Ziff Davis’ bonds, we are very familiar with the credit. Given Ziff’s very low cost of debt capital, the depressed equity valuation stood out to us. Over the course of the year, we accumulated a position in Ziff Davis securities in the low-30s, and we now view the strategic review as a catalyst for resolving this dislocation.
What makes the situation particularly compelling is Vivek Shah’s capital allocation skill and private-equity mindset. In 2010, Vivek executed a management-led buyout of Ziff Davis and later sold the company for more than a 3x MOIC. Whether through targeted divestitures, substantial capital returns to shareholders, or a more comprehensive transaction, we believe the strategic review creates a credible path to unlocking value that could be measured in multiples of the company’s current equity market capitalization.
Outlook
Although our resources are primarily focused on the micro, the macro cannot be ignored. Across the world, 2025 featured seismic political, regulatory, and technological shifts. Bonds were comfortably positive, equities were up, and credit spreads tightened over the year. Taken together, this would suggest a perception of safety in the market. Yet gold and silver have been moving parabolically higher. These two facts stand largely in opposition to one another.
In addition, certain pockets of private capital, from private credit to private equity and real estate, have been facing genuine adversity. In Canada, despite a meaningful reduction in short-term interest rates, more than $30Bn of real estate funds have gated, and we are looking ahead to what could be a challenging renegotiation of USMCA. These macro headlines all underline the value of the micro and the necessity of “picking your spots.”
We look forward to picking our spots in 2026 for you.
Thank you for your partnership in the Ewing Morris Select Credit Fund LP.
Performance is based on returns for the Ewing Morris Select Credit Fund LP. The inception date of the strategy is April 29, 2020. As of May 1, 2025, returns are based on Class P, net of fees and expenses. Class P units bear management fees of 0.75% per annum, as well as performance fees, as applicable. From February 1, 2025 to April 30, 2025, the returns presented were those of Class S of the Fund, which bear management fees of 0.5% per annum, as well as performance fees, as applicable. From April 29, 2020 to January 31, 2025, returns are based on a separately managed account that shared a similar investment objective and strategy as the Ewing Morris Select Credit Fund LP and were calculated net of fees and expenses matching those of Class P.
While the Fund’s overall investment objective remains the same, past performance is not indicative of future performance. Where the performance period is longer than 12 months, returns are annualized. The 2020 return represents performance from the inception of the Fund to December 31, 2020. Please note that firm AUM is an estimate until all NAVs are finalized. Percentages may not add up to 100% due to rounding to the nearest percent.
The U.S. High Yield Bond Benchmark is represented by the iShares U.S. High Yield Bond Index ETF (CAD-Hedged). This benchmark has been selected for the Ewing Morris Select Credit Fund LP because it is a low-cost, index-tracking fund, representative of an individual’s opportunity cost in higher-yield fixed income, and is a widely known and followed fixed income benchmark. These benchmark indices are provided for informational purposes only, and comparisons to benchmarks and indices have limitations.
Investing in fixed income securities is the primary strategy of the Fund; however, the Fund does not invest in all, or necessarily any, of the securities that comprise the referenced benchmark indices. The Fund’s portfolio may contain, among other things, options, short positions, other securities, concentrated positions, and may employ leverage that is not reflected in these indices. As a result, no market index is directly comparable to the results of the Fund. Returns are unaudited.
This letter does not constitute an offer to sell units of any Ewing Morris Fund, collectively referred to as “Ewing Morris Funds.” Units of Ewing Morris Funds are only available to investors who meet applicable suitability and sophistication requirements.
As of December 31, 2025
Fellow Limited Partners,
In 2025, your Select Credit Fund Returned +5.7%. This return compares to our publicly traded high yield benchmark, which returned +6.3%.
Since its inception in May of 2020, the Fund has delivered a compound annual return of 9.2%, net of all fees.
1. Ewing Morris Select Credit Fund LP returns reflect Class P - Master Series, net of fees and expenses as of December 31, 2025. Inception date of the strategy is April 29, 2020. See further description in disclaimer. U.S. High Yield Bonds are represented by the iShares U.S. High Yield Bond Index ETF (CAD-Hedged). Canadian Investment Grade Bonds are represented by the iShares Canadian Corporate Bond Index ETF. See Additional Disclosures. All market-based data sourced from Bloomberg LP.
Performance
For countries, markets and companies, every year has its own features and contours. 2025 was no different. From a market perspective, one striking observation was just how homogenous returns were across fixed income. From top quality investment grade bonds to low quality high yield, realized returns fell generally within a 2% range. Looking at the Fund, our +5.7% absolute return in 2025 was a reasonable outcome, albeit short of our long-term average return. While 2025’s return was under long-term averages, both the history of the strategy as well as concentration of the portfolio itself points to the potential for strong returns albeit being unevenly distributed across time.
Moving into 2026, the portfolio maintains its high focus, with the top three issuers totaling more than 40% as of the year end. The portfolio also features a pocket (less than 20%) of engagement-related equity securities, which is balanced by a significant investment grade spread hedge in the event of any adverse market events.
The Contours of 2025
The Trump Tariff Tantrum
In April, the high-yield market sold off sharply following Trump’s stunning opening salvo in global trade negotiations. This was a time when our portfolio risk management shone. Although the market rebounded and ended the month up, we were very pleased with the portfolio’s performance during this tumultuous period and share our intra-month performance with you, which used Bloomberg market pricing. The outperformance in these market down-months was consistent with both our portfolio positioning and our historical performance since inception.
The Power of People
As our study of shareholder engagement and corporate governance deepens, it has become clear to us that companies do not just exist “out there” as operating assets and a collection of contracts. An alternative perspective is that companies can be thought of as deeply social organizations engaged in commercial decision making. And, like any social organization, decision-making authority tends to follow a power-law distribution rather than being evenly spread across the organization, especially in today’s professional director milieu. This fact of life should be exceptionally central to credit investors, because decisions made by one or a few people can alter the trajectory of a credit far more than the gradual movement of the underlying business. This makes the task of determining who these players are and what they want foundational to understanding many credits. It is through the decision making of a few that balance sheets can strengthen, weaken, or transform entirely. On this theme, three examples from the year come to mind.
Larry Ellison - Oracle
Through 2025, one of the Fund’s largest credit short positions was in the long bonds of Oracle at ~5%. These bonds fit well in our long-dated investment grade credit spread hedge basket as Oracle had long demonstrated credit-unfriendly behaviour (tens of billions of share buybacks over time and a five billion-dollar annual dividend, for example). Another attractive feature in Oracle is that transaction costs were low given that the company is among the most liquid long-dated issuers in US investment grade market.
Oracle is unusual in that it is, in large part, controlled by one person: Larry Ellison. Larry is the founder, Chief Technology Officer, and Executive Chair, and he owns 40% of Oracle. This means that what happens to the balance sheet is essentially up to Larry Ellison. In 2025, Larry stepped on the gas, leveraging the company’s balance sheet in pursuit of competitiveness in the AI data center space. At the same time, through his son David, Larry also funded a substantial merger between Skydance and Paramount, with a combined enterprise value of approximately $28Bn, and engaged in a greater than $100Bn bidding war with Netflix over Warner Bros. Discovery.
It is therefore no surprise that Oracle’s credit spreads widened materially in 2025. From the beginning of the year to the time of this writing, Oracle’s 2054 bonds lost approximately 12% in price relative to their benchmark Treasury. A 12% relative price gain versus an approximately 1.2% annual credit spread hedging cost illustrates the asymmetry of the “portfolio insurance” we maintain. With most investment grade credit spreads at or near their lows at other issuers, our portfolio’s hedge has strong prospects of delivering profits in periods of market adversity, should such an environment emerge.
Electronic Arts
A great example of the machinations of social dynamics was found in Electronic Arts (EA). Although we did not own the company’s 2051 bonds, it is a credit case study for the ages that we highlighted on X, which garnered more than 100,000 views. The precise catalyst for the deal is difficult to know from the outside, but a strong argument could be made that the Trump administration’s receptive posture toward the Middle East, combined with newly well-positioned relationships, including Jared Kushner, made a deal possible that may have been impossible for many years. Through the influence and agency of a small number of dynamic individuals, a long-dormant outcome became achievable.
While this deal underlined what is possible through the power of a few people and deep public and private credit markets, it also showed the investment grade corporate bond market something significant. EA’s investment grade–rated bonds due in 2051 traded up from approximately 65 and are now closing in on what appears likely to be 101. This represents roughly a 55 percent price gain on an investment grade–rated bond.
This would also be one of the few times we have seen the prospective takeover premium of the bonds exceed, by more than two times, that of the equity. With this anomalous upside optionality laid bare, we pounced on other safe, long-duration credits that carry similar optionality and continue to find more. Given that there are swathes of investment grade bonds issued in 2021 that now trade at significant discounts, we do not believe that this EA outcome will be an isolated event.
Shawn Sedaghat – TriMas Corporation
TriMas is an industrial conglomerate that had experienced some brushes with activism but had largely been a self-governing company. That changed when a private investor, Shawn Sedaghat, acquired 10% of the company’s stock and joined its board. This was a case in which a single individual appeared to catalyze not only a change in management, but also the sale of the majority of the company’s assets and the creation of a Strategic Investment Committee, all within a year and a half—a truly remarkable achievement.
This case was also instructive because it demonstrated that credit markets often do not respond properly to situations involving shifting balances of power, situations we have experience identifying. In the case of TriMas, after Mr. Sedaghat filed his initial ownership disclosure via a Form 13-D, we took an interest in the situation and began evaluating the various paths the company could take. Several months later, TriMas announced that its CEO would be stepping down. This was a threshold signal to us that meaningful change was possible and that there was now underappreciated upside potential in the bonds. We were among the first in the market to take a meaningful position in the company’s bonds at 91.5 following the leadership news. Fast forward to today, and we are now evaluating a potential asset disposition at par, with the bonds currently trading in the upper 97 range.
Vivek Shah - Ziff Davis Corporation
Ziff Davis is a digital media conglomerate that the public markets have largely written off, with sentiment shaped by the belief that AI has structurally impaired its underlying businesses. That pessimism has driven the equity to trade as low as 3x 2025 EBITDA and, more strikingly, to imply a substantial discount to the company’s sizable cash and investment balance. In effect, the market has assigned a material “capital allocator discount” to Ziff Davis, a condition that CEO Vivek Shah is both responsible for and capable of resolving.
To this end, in November, following inbound interest, the company announced a strategic review. With the equity still trading at a multiple in the mid-3x range, the market continues to bet against the business. Given the strategic review, however, this has effectively become a bet against Vivek Shah and his ability to monetize a collection of durable, cash-flowing platforms that trade substantially below both public comparables and private-market value.
Having invested in three of Ziff Davis’ bonds, we are very familiar with the credit. Given Ziff’s very low cost of debt capital, the depressed equity valuation stood out to us. Over the course of the year, we accumulated a position in Ziff Davis securities in the low-30s, and we now view the strategic review as a catalyst for resolving this dislocation.
What makes the situation particularly compelling is Vivek Shah’s capital allocation skill and private-equity mindset. In 2010, Vivek executed a management-led buyout of Ziff Davis and later sold the company for more than a 3x MOIC. Whether through targeted divestitures, substantial capital returns to shareholders, or a more comprehensive transaction, we believe the strategic review creates a credible path to unlocking value that could be measured in multiples of the company’s current equity market capitalization.
Outlook
Although our resources are primarily focused on the micro, the macro cannot be ignored. Across the world, 2025 featured seismic political, regulatory, and technological shifts. Bonds were comfortably positive, equities were up, and credit spreads tightened over the year. Taken together, this would suggest a perception of safety in the market. Yet gold and silver have been moving parabolically higher. These two facts stand largely in opposition to one another.
In addition, certain pockets of private capital, from private credit to private equity and real estate, have been facing genuine adversity. In Canada, despite a meaningful reduction in short-term interest rates, more than $30Bn of real estate funds have gated, and we are looking ahead to what could be a challenging renegotiation of USMCA. These macro headlines all underline the value of the micro and the necessity of “picking your spots.”
We look forward to picking our spots in 2026 for you.
Thank you for your partnership in the Ewing Morris Select Credit Fund LP.
Performance is based on returns for the Ewing Morris Select Credit Fund LP. The inception date of the strategy is April 29, 2020. As of May 1, 2025, returns are based on Class P, net of fees and expenses. Class P units bear management fees of 0.75% per annum, as well as performance fees, as applicable. From February 1, 2025 to April 30, 2025, the returns presented were those of Class S of the Fund, which bear management fees of 0.5% per annum, as well as performance fees, as applicable. From April 29, 2020 to January 31, 2025, returns are based on a separately managed account that shared a similar investment objective and strategy as the Ewing Morris Select Credit Fund LP and were calculated net of fees and expenses matching those of Class P.
While the Fund’s overall investment objective remains the same, past performance is not indicative of future performance. Where the performance period is longer than 12 months, returns are annualized. The 2020 return represents performance from the inception of the Fund to December 31, 2020. Please note that firm AUM is an estimate until all NAVs are finalized. Percentages may not add up to 100% due to rounding to the nearest percent.
The U.S. High Yield Bond Benchmark is represented by the iShares U.S. High Yield Bond Index ETF (CAD-Hedged). This benchmark has been selected for the Ewing Morris Select Credit Fund LP because it is a low-cost, index-tracking fund, representative of an individual’s opportunity cost in higher-yield fixed income, and is a widely known and followed fixed income benchmark. These benchmark indices are provided for informational purposes only, and comparisons to benchmarks and indices have limitations.
Investing in fixed income securities is the primary strategy of the Fund; however, the Fund does not invest in all, or necessarily any, of the securities that comprise the referenced benchmark indices. The Fund’s portfolio may contain, among other things, options, short positions, other securities, concentrated positions, and may employ leverage that is not reflected in these indices. As a result, no market index is directly comparable to the results of the Fund. Returns are unaudited.
This letter does not constitute an offer to sell units of any Ewing Morris Fund, collectively referred to as “Ewing Morris Funds.” Units of Ewing Morris Funds are only available to investors who meet applicable suitability and sophistication requirements.
As of December 31, 2025

Minimizing Tax Drag (Part 2)
Any tax-conscious investor should be transfixed by the opportunities (and pitfalls) in fixed income. This is our account of the landscape.

Schedule a
Conversation


Connect with Peers


Explore Our Full Library


Library


Minimizing Tax Drag (Part 2)