Fellow Limited Partners of the Ewing Morris Flexible Fixed Income Fund,
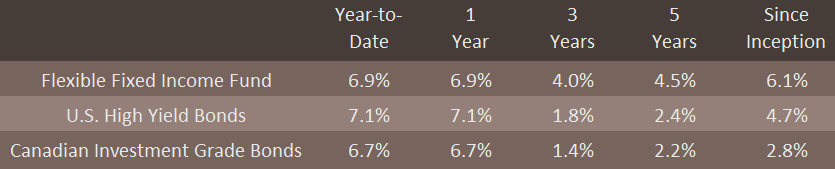
In 2024, the Flexible Fixed Income Fund Returned +6.9%. This return compares to our publicly traded high yield and investment grade benchmarks, which returned +7.1% and +6.7%, respectively.
Since its inception in early 2016, the Fund has delivered a compound annual return of 6.1%, meeting our long-term return expectations of 5% to 7% and exceeding our benchmarks by a meaningful margin.
The Year in Review
2024 was an undeniably strong year across many asset classes, especially equities. After being up 25% in2023, the S&P 500 was again up another 24% in 2024. Gold was up 27%. Even the S&P/TSX found itself up 22%.
But fixed income was a different story. Results varied. At a high level, the greater the credit risk taken, the greater the realized reward. This meant more defensive-leaning portfolios lagged.
For example, the (credit) risk-free 10-year US treasury produced total return of -1.7% despite entering the year bearing a 3.9% yield. On the other hand, our high yield benchmark delivered a respectable return in the year of +7.1%.
As for the Flexible Fixed Income Fund - its performance largely kept pace with both our high yield and investment grade benchmarks, providing a +6.9% return. But this result was achieved in spite of a vastly lower credit risk profile throughout the year - not because of it. In 2024, the Fund had two main attributes that made it relatively defensive: lower credit risk investments and equity index hedges.
The lowest quality segment of high yield (CCC rated bonds) was the standout contributor to high yield returns. This part of the market returned 15%. While we don’t avoid these bonds categorically, we simply did not find any bonds in this rating tier attractive enough to own. This may not come as a surprise in light of where we appear to be in the economic cycle and the fact that CCC’s have a 26%default rate.3 By this comparison, we took meaningfully less credit risk than our benchmark. This lower level of risk taking detracted from returns - at least in 2024.
We also saw performance detraction from large cap equity index exposure. As a means to reduce overall risk in the portfolio, we maintained a hedge in the S&P 500, which we unwound in July and September in favor of a hedge with superior upside/downside in investment grade credit. This short exposure detracted 1.2% from returns in the year. We’re also comfortable in concluding that we will be favoring single name equity hedges to credit positions in our portfolio over outright index hedges going forward.
The Opportunity in Investment Grade Credit
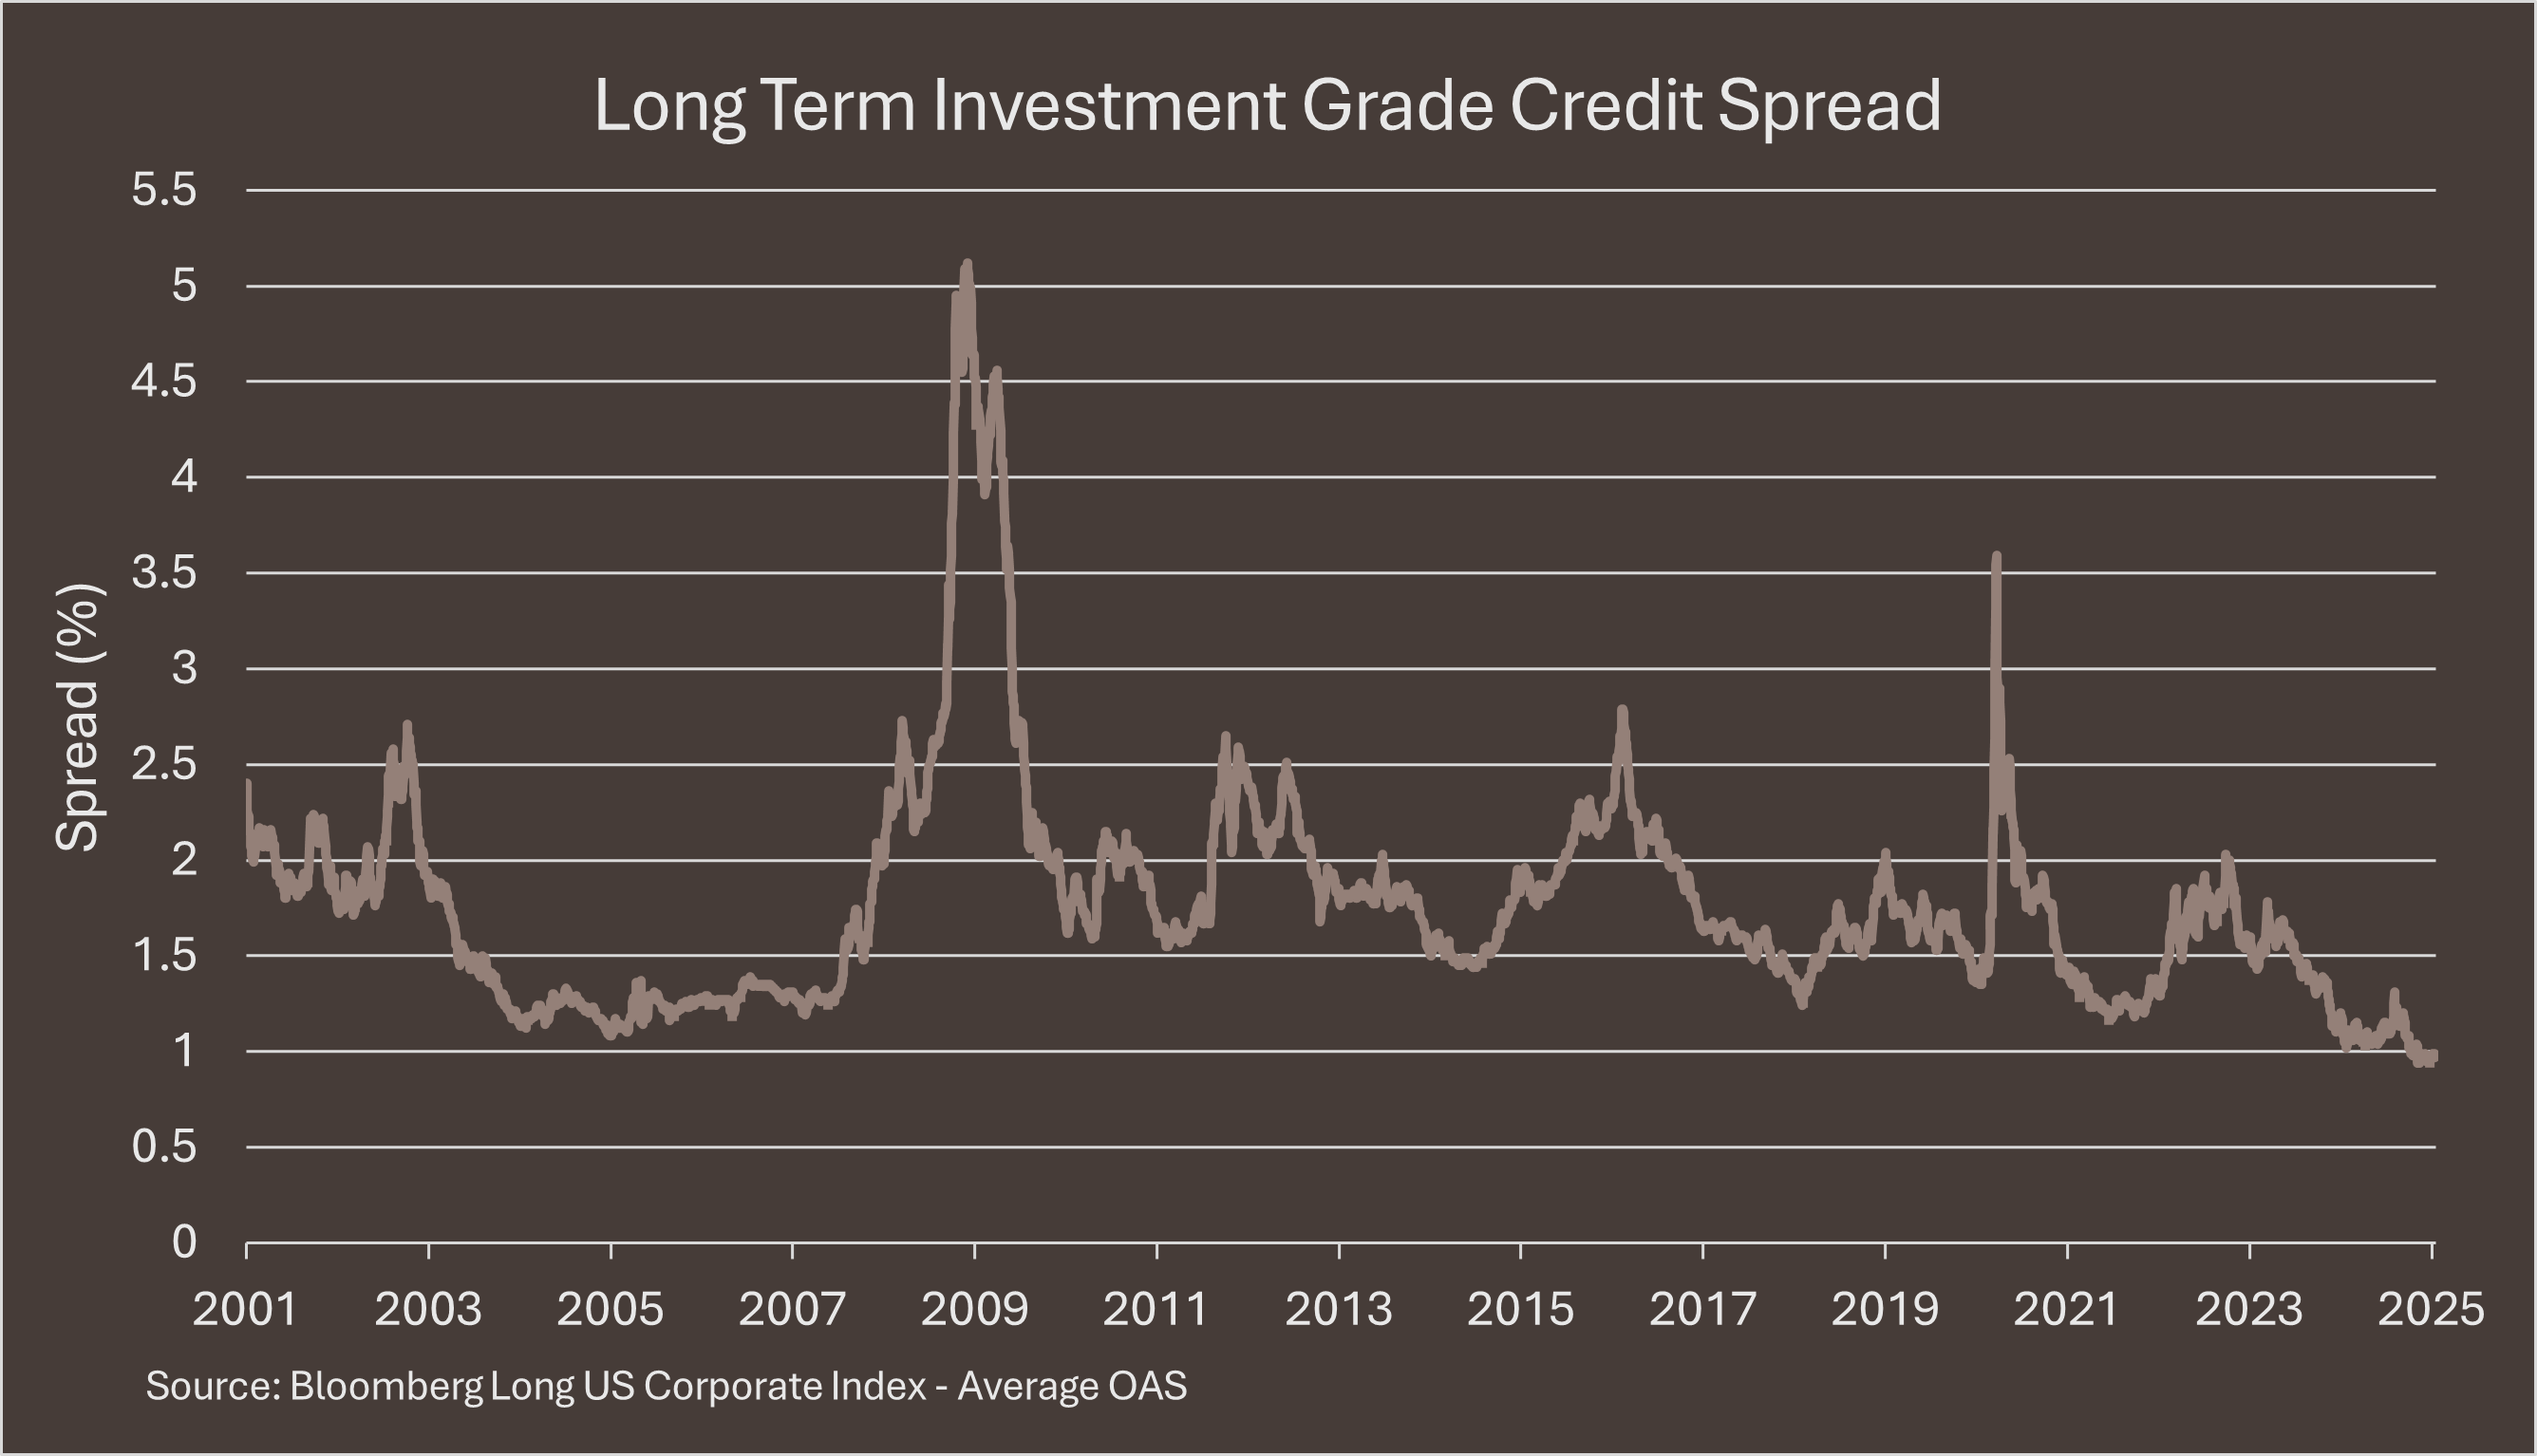
It’s not every day that a fixed income market breaks 24-year records. But, in December this happened in investment grade credit. Compensation for taking credit risk - the extra yield received over the yield of a government bond of a similar term (the ”credit spread”) narrowed to levels we have not seen since the early 2000’s.
History has shown that once credit gets as expensive as it has, investing in a manner that profits from spread widening becomes quite sensible. It’s sensible not only because it offers a large reward relative to its cost, but because it can pay off at a very valuable time: when market conditions are worsening.
What’s attractive to us is that today’s credit spreads carry a kind of certainty about the future: that the economy’s growth trajectory will not change. That G-7 fiscal issues will not be a problem. That the risk of inflation is over. That President Trump will not unsettle the market through his foreign policies or his social media account.
We’ve seen the credit market carry generous assumptions about the future before. In 2021, spreads were exceptionally tight. We took full advantage of this as we outlined in our Q2-2021 Letter and unwound the position profitably in 2022, as we outlined in our Q2-2022 Letter.
At current levels, we believe the opportunity is here again. We have positioned the portfolio through a diversified credit hedge in long term investment grade corporate bonds as a low-cost way to profit from rugged market realities that could easily come into view.
The Deals They Are a Comin’
A logical consequence (and silver lining) of narrow credit spreads is M&A. Regulatory intervention has created a deal-queue of sorts in the past four years. But now, the new administration is likely to turn this queue into a conga line. Almost all other conditions for dealmaking are in place: credit markets are wide open, dry powder at private equity firms is ample and shareholder activism is on the rise. Suffice it to say, the stage is set for a very active year. And we intend to capitalize on it for you.
The Opportunity in Event-Driven Credit
It should come as no surprise that shareholder activism is not a bondholder’s forte. Fortunately, to the great benefit of our fixed income work, we’ve acquired an eye for shareholder engagement thanks to learning from our equity work. This enhanced understanding of corporate governance and shareholder dynamics has resulted in a highly differentiated perspective in fixed income.
With this approach, our job becomes simple (but not easy): first, to find situations where shareholders hold a strong hand in driving for change and second, to find the bonds that benefit the most from this. We are especially interested in this niche because pessimistic credit investors tend to pay nothing for what isn't a matter of fact (or for something that they have not noticed in the first place). Given this dynamic, we believe there exists free option value in certain bonds in the market that fall within this interesting market niche. We have shared examples of this hidden option value in Catalent and Techtarget in our Q1-2024 Letter and we hope to report back with more examples as the year progresses.
Outlook
The forthcoming year appears to be extraordinarily consequential. There exists a wide range of outcomes. We have positioned the portfolio to withstand and capitalize on this array of scenarios. Meanwhile, our process for generating investment ideas has gained in its capacity, supported by careful attention to activist developments and contract-based insight. We are also embracing the newest AI based utilities to enhance the speed of both idea discovery and situational understanding once a high promise prospective investment has been found.
Thank you for your investment in the Ewing Morris Flexible Fixed Income Fund.
Inception date of the Flexible Fixed Income Fund is February 1, 2016. Flexible Fixed Income Fund returns reflect ClassP - Master Series, net of fees and expenses. We have listed the iShares U.S. High Yieald Bond Index ETF (CAD-Hedged),iShares Canadian Corporate Bond Index ETF, Bloomberg US High Yield Corporate Bond Index Yield and Bloomberg USCorporate Bond Index Yield as benchmark indices/data for the high yield and corporate bond markets, as these arewidely known and used benchmark indices/data for fixed income markets. The Fund has a flexible investmentmandate and thus these benchmark indices are provided for information only. Comparisons to these benchmarks andindices have limitations. Investing in fixed income securities is the primary strategy for the Fund, however the Funddoes not invest in all, or necessarily any, of the securities that compose the referenced benchmark indices, and theFund portfolio may contain, among other things, options, short positions and other securities, concentrated levels ofsecurities and may employ leverage not found in these indices. As a result, no market indices are directly comparableto the results of the Fund. Past performance does not guarantee future returns. This letter does not constitute anoffer to sell units of any Ewing Morris Fund, collectively, “Ewing Morris Funds”. Units of Ewing Morris Funds are onlyavailable to investors who meet investor suitability and sophistication requirements. While information prepared inthis report is believed to be accurate, Ewing Morris & Co. Investment Partners Ltd. makes no warranty as to thecompleteness or accuracy nor can it accept responsibility for errors in the report. This report is not intended for publicuse or distribution. There can be no guarantee that any projection, forecast or opinion will be realized. All informationprovided is for informational purposes only and should not be construed as personal investment advice. Users ofthese materials are advised to conduct their own analysis prior to making any investment decision. Source for datareferenced and benchmark information: Capital IQ, Bloomberg and Ewing Morris. As of December 31, 2024.
Fellow Limited Partners of the Ewing Morris Flexible Fixed Income Fund,
In 2024, the Flexible Fixed Income Fund Returned +6.9%. This return compares to our publicly traded high yield and investment grade benchmarks, which returned +7.1% and +6.7%, respectively.
Since its inception in early 2016, the Fund has delivered a compound annual return of 6.1%, meeting our long-term return expectations of 5% to 7% and exceeding our benchmarks by a meaningful margin.
The Year in Review
2024 was an undeniably strong year across many asset classes, especially equities. After being up 25% in2023, the S&P 500 was again up another 24% in 2024. Gold was up 27%. Even the S&P/TSX found itself up 22%.
But fixed income was a different story. Results varied. At a high level, the greater the credit risk taken, the greater the realized reward. This meant more defensive-leaning portfolios lagged.
For example, the (credit) risk-free 10-year US treasury produced total return of -1.7% despite entering the year bearing a 3.9% yield. On the other hand, our high yield benchmark delivered a respectable return in the year of +7.1%.
As for the Flexible Fixed Income Fund - its performance largely kept pace with both our high yield and investment grade benchmarks, providing a +6.9% return. But this result was achieved in spite of a vastly lower credit risk profile throughout the year - not because of it. In 2024, the Fund had two main attributes that made it relatively defensive: lower credit risk investments and equity index hedges.
The lowest quality segment of high yield (CCC rated bonds) was the standout contributor to high yield returns. This part of the market returned 15%. While we don’t avoid these bonds categorically, we simply did not find any bonds in this rating tier attractive enough to own. This may not come as a surprise in light of where we appear to be in the economic cycle and the fact that CCC’s have a 26%default rate.3 By this comparison, we took meaningfully less credit risk than our benchmark. This lower level of risk taking detracted from returns - at least in 2024.
We also saw performance detraction from large cap equity index exposure. As a means to reduce overall risk in the portfolio, we maintained a hedge in the S&P 500, which we unwound in July and September in favor of a hedge with superior upside/downside in investment grade credit. This short exposure detracted 1.2% from returns in the year. We’re also comfortable in concluding that we will be favoring single name equity hedges to credit positions in our portfolio over outright index hedges going forward.
The Opportunity in Investment Grade Credit
It’s not every day that a fixed income market breaks 24-year records. But, in December this happened in investment grade credit. Compensation for taking credit risk - the extra yield received over the yield of a government bond of a similar term (the ”credit spread”) narrowed to levels we have not seen since the early 2000’s.
History has shown that once credit gets as expensive as it has, investing in a manner that profits from spread widening becomes quite sensible. It’s sensible not only because it offers a large reward relative to its cost, but because it can pay off at a very valuable time: when market conditions are worsening.
What’s attractive to us is that today’s credit spreads carry a kind of certainty about the future: that the economy’s growth trajectory will not change. That G-7 fiscal issues will not be a problem. That the risk of inflation is over. That President Trump will not unsettle the market through his foreign policies or his social media account.
We’ve seen the credit market carry generous assumptions about the future before. In 2021, spreads were exceptionally tight. We took full advantage of this as we outlined in our Q2-2021 Letter and unwound the position profitably in 2022, as we outlined in our Q2-2022 Letter.
At current levels, we believe the opportunity is here again. We have positioned the portfolio through a diversified credit hedge in long term investment grade corporate bonds as a low-cost way to profit from rugged market realities that could easily come into view.
The Deals They Are a Comin’
A logical consequence (and silver lining) of narrow credit spreads is M&A. Regulatory intervention has created a deal-queue of sorts in the past four years. But now, the new administration is likely to turn this queue into a conga line. Almost all other conditions for dealmaking are in place: credit markets are wide open, dry powder at private equity firms is ample and shareholder activism is on the rise. Suffice it to say, the stage is set for a very active year. And we intend to capitalize on it for you.
The Opportunity in Event-Driven Credit
It should come as no surprise that shareholder activism is not a bondholder’s forte. Fortunately, to the great benefit of our fixed income work, we’ve acquired an eye for shareholder engagement thanks to learning from our equity work. This enhanced understanding of corporate governance and shareholder dynamics has resulted in a highly differentiated perspective in fixed income.
With this approach, our job becomes simple (but not easy): first, to find situations where shareholders hold a strong hand in driving for change and second, to find the bonds that benefit the most from this. We are especially interested in this niche because pessimistic credit investors tend to pay nothing for what isn't a matter of fact (or for something that they have not noticed in the first place). Given this dynamic, we believe there exists free option value in certain bonds in the market that fall within this interesting market niche. We have shared examples of this hidden option value in Catalent and Techtarget in our Q1-2024 Letter and we hope to report back with more examples as the year progresses.
Outlook
The forthcoming year appears to be extraordinarily consequential. There exists a wide range of outcomes. We have positioned the portfolio to withstand and capitalize on this array of scenarios. Meanwhile, our process for generating investment ideas has gained in its capacity, supported by careful attention to activist developments and contract-based insight. We are also embracing the newest AI based utilities to enhance the speed of both idea discovery and situational understanding once a high promise prospective investment has been found.
Thank you for your investment in the Ewing Morris Flexible Fixed Income Fund.
Inception date of the Flexible Fixed Income Fund is February 1, 2016. Flexible Fixed Income Fund returns reflect ClassP - Master Series, net of fees and expenses. We have listed the iShares U.S. High Yieald Bond Index ETF (CAD-Hedged),iShares Canadian Corporate Bond Index ETF, Bloomberg US High Yield Corporate Bond Index Yield and Bloomberg USCorporate Bond Index Yield as benchmark indices/data for the high yield and corporate bond markets, as these arewidely known and used benchmark indices/data for fixed income markets. The Fund has a flexible investmentmandate and thus these benchmark indices are provided for information only. Comparisons to these benchmarks andindices have limitations. Investing in fixed income securities is the primary strategy for the Fund, however the Funddoes not invest in all, or necessarily any, of the securities that compose the referenced benchmark indices, and theFund portfolio may contain, among other things, options, short positions and other securities, concentrated levels ofsecurities and may employ leverage not found in these indices. As a result, no market indices are directly comparableto the results of the Fund. Past performance does not guarantee future returns. This letter does not constitute anoffer to sell units of any Ewing Morris Fund, collectively, “Ewing Morris Funds”. Units of Ewing Morris Funds are onlyavailable to investors who meet investor suitability and sophistication requirements. While information prepared inthis report is believed to be accurate, Ewing Morris & Co. Investment Partners Ltd. makes no warranty as to thecompleteness or accuracy nor can it accept responsibility for errors in the report. This report is not intended for publicuse or distribution. There can be no guarantee that any projection, forecast or opinion will be realized. All informationprovided is for informational purposes only and should not be construed as personal investment advice. Users ofthese materials are advised to conduct their own analysis prior to making any investment decision. Source for datareferenced and benchmark information: Capital IQ, Bloomberg and Ewing Morris. As of December 31, 2024.

2025 Q1 Letter
Fellow Limited Partners,
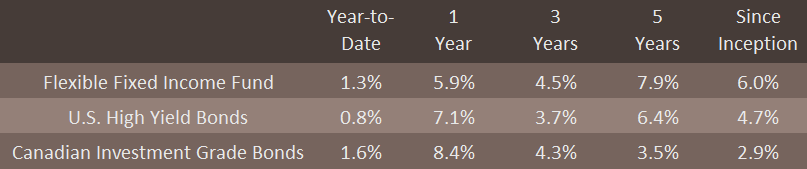
In the first quarter of 2025, the Flexible Fixed Income Fund returned +1.3%. This return compares to our publicly traded high yield and investment grade benchmarks, which returned +0.8% and +1.6%,respectively.
Since its inception in early 2016, the Fund has delivered a compound annual return of 6.0%, meeting our long-term net return expectations of 5% to 7% and exceeding our benchmarks by a meaningful margin.
While it is easy to expect the world and markets to unfold in a straightforward progression, on occasion, reality brings something different. This year certainly has - from non-linear policy changes to non-linear market reactions.
The Yield is High Again
A defenestration of long-held economic and state doctrine by current US leadership has marked the beginning of something valuable: higher yields. 2025 (and 2026 for that matter) may turn out to be one of the most opportunity-rich years we have seen in a long time. Of course, we do not know for certain if these years will be high returning, but what we do know is that when uncertainty reigns, returns tend to follow, especially in high yield bonds.
In the corporate bond market, two important things have happened. First, in the United States, interest rates for US Treasury bonds have risen substantially on questions regarding the safe-haven status of US assets. This is not a welcome development for US policymakers and might be a step-change that produces a long-term tailwind for fixed income returns. Second, there has been a spike in credit spreads in anticipation of a more difficult economic environment ahead. These two factors have combined to push high yield bond yields back to levels that reflect emerging concerns of recession. This makes the opportunity set more interesting, not less. We are looking forward to the year ahead.
Timely Tax Takeaways
As tax season is upon us, you might welcome something positive on this topic. As the substantial majority of our investors are tax-paying individuals and families, we believe it is our duty to incorporate an after-tax mindset in our bond investment activity. To our delight, we have observed that the market largely does not differentiate between bonds based on their tax characteristics. Naturally, we have been capitalizing on this dynamic for you since the Fund’s inception, more than nine years ago.
The essence of this tax-aware mindset is to favor bonds issued with low interest rates (a low “coupon”). Since market yields change, bond prices also change to reflect a new fair rate of return. This means bonds with very low, below-market coupons tend to be priced at attractive discounts to par. The lower a bond’s coupon, the higher the price discount. Through this price discount, a bond’s return becomes more valuable. A bond priced at a discount earns its return not only through its coupon, but (importantly) through the gradual appreciation of its price to par maturity. And the greater the price discount, the greater proportion of the bond’s total return will be generated from the bond’s price appreciation. This price appreciation is counted as a capital gain, which bears substantially more favorable tax treatment than ordinary interest income. In an asset class that sweats over basis points (one-hundredths of a percent), this is a highly valuable nuance for taxable clients. And while this approach produces no difference to the pre-tax results you see on the facing page of this letter, it certainly makes a difference to your bank account and in a few other ways which we will share.
Tax Deferral: Taxes on interest income are paid annually as the income is received, so a traditional, high-coupon bond results in a higher tax bill every year. By contrast, a low-coupon, discounted bond gradually moving to par incurs little tax until the year of its sale (or its maturity), effectively postponing much of the tax impact, better compounding an investment’s value.
Success-Based Taxes: Taxes on capital gains are owed only if the bond is sold at a profit. When the bulk of an investment’s expected return comes from price appreciation, this is advantageous. Capital gains tax is, by definition, contingent on the success of the investment. On the other hand, high-coupon bonds generate taxable interest every year, even if the bond later loses value or – even worse – the company goes bankrupt.
Safer Return Generation: Since higher yields typically mean higher credit risk, we are always seeking more conservative ways to achieve safer after-tax returns. By taking advantage of the tax benefits of discounted, low-coupon bonds, we can often match the after-tax return of a higher-yield, higher-risk bond, through a substantially lower-risk company.
Pleasant Surprises: Another benefit comes from company takeovers. Each year, it’s not unusual for four to five percent of public companies to be delisted due to mergers or acquisitions. When this happens, their bonds are very often paid off at par or better. Discounted bonds, in these cases, contain a “hidden bonus” - the chance for an immediate and positive jump in value if such an event occurs. We should add that this value is not theoretical – we experienced two of these events in the portfolio just last year.
Where Flexibility Counts
While this concept is simple, we have taken it very seriously. We have applied this lens as we’ve scoured the market for opportunities. Fortunately, we found an excellent base for tax-advantaged idea generation: the US convertible bond market. These bonds (which must be paid in cash at their maturity unlike their Canadian counterparts) typically bear coupons between zero and two percent and have five-year terms. This US$300 billion-dollar market trades primarily over equity or equity derivative desks, putting it outside the scope of convenience for traditional fixed income investors. We also like that, given the number of issuers (~500), at any given time there are convertible bond issuers that are amid some adversity or mispricing. We have shared convertible bond case studies to highlight this attractive space in prior communications. In sum, our activity in this fixed income market niche is an excellent example of how we use our flexible mandate to generate quality risk-adjusted returns.
So why doesn’t everyone else focus on low coupon bonds? The reasons are many.
Clients: The investment management industry – fixed income in particular - has very substantial customers in pensions, endowments and foundations. These entities are the often the largest and most popular organizations to service. These entities are tax-exempt, so they do not care about the sources of return. Investment managers who count these entities as large clients (almost any manager of scale) may naturally jettison tax considerations as well.
Marketing: Because of the multi-faceted nature of taxes and varying individual tax rates, it is not particularly easy to communicate results with respect to tax. In addition, since pre-tax returns are the industry standard basis of competition, it should not be a surprise that many managers simply optimize for ‘headline’ (pre-tax) fund returns.
Size: For large asset managers (which most fixed income managers are), capital is always required to be put to work. This often presents a problem, where a manager is very much constrained by what’s available in the market. What is available isn’t always economically convenient. Indeed, there are numerous examples of highly liquid bonds in the market having average (or worse) tax characteristics.
Fortunately, we are largely free (or unbothered by) these constraints and have taken full advantage of this for you. If you are interested in your individual mix of taxable gains, we would be delighted to connect on this.
Outlook
It has taken a wholesale change in fiscal, foreign and trade policies, but fixed income is once again pricing in a good portion of the uncertainty many feel about the future. As of this writing, while not at extreme levels, the market has moved to the pessimistic side of the sentiment ledger. This should be welcomed; the more pessimism that is reflected in a bond’s price, the safer an investment it tends to become.
With this recent change in overall attractiveness of the bond market, we have been active in taking advantage of better expected returns in the market, boosting the portfolio’s overall yield through the reduction of hedges and the addition of new credits in the fund. Despite this activity, our positioning remains ‘below market’ in terms of credit risk. Plenty of sand, wrenches and all-caps tweets have been thrown into the gears of the world economy. Perhaps we have already seen “peak uncertainty”, but it also remains to be seen whether we are past “peak pain”. It is impossible to know. This is why we regularly remind ourselves that the only job of economic or market forecasting is to make astrology look respectable. In contrast, our job is simple: find great opportunities come rain or shine, one investment at a time.
Thank you for your investment in the Ewing Morris Flexible Fixed Income Fund.

Schedule a
Conversation


Connect with Peers


Explore Our Full Library


Library


Minimizing Tax Drag (Part 2)