Fellow Limited Partners,
In the third quarter of 2025, the Select Credit Fund returned +1.9%.This return compares to our publicly traded high yield and investment grade benchmarks, which returned +1.6% and +1.9%, respectively.
Since its inception in 2020, the strategy has delivered a compound annual return of 9.6%.

Performance
Following the liberation day shock and rebound in the second quarter, markets in the third quarter were, by comparison, quite calm and uneventful. Year-to-date, the performance of the Fund has generally matched the broader fixed income space.
The Brief
Portfolio Focus
Top three issuer exposure is at the lower end of its historical range - 39% - spread across telecommunication, enterprise software and healthcare.
Long Exposure
The portfolio’s long exposure in corporate securities is 67%. Since our highest conviction ideas tend to be ‘lumpy’ in both size and timing, this is not unusual. Most of this exposure is in highly tax-efficient investments – 46 percentage points in convertibles (which bear very low coupons) and 9 percentage points in equity exposure.
Equity Exposure
The strategy’s history has seen some (~20%) equity exposure when opportunities are sufficiently abundant. On occasion, we find superior situations in equities where we have credit-driven insight or where we can see optionality for value-unlock through shareholder engagement or M&A. As we have observed costs of credit dropping through the floor in 2025, we have expanded our equity exposure accordingly as we have found opportunities for engagement and takeout optionality. We currently have a 5% weight in Ziff Davis that combines many of these attractive dynamics. Despite trading at 3.5x EBITDA, the company’s debt cost of capital is less than six percent.2 This, combined with shareholder displeasure, resilient underlying business performance and the CEO’s deep experience in private equity (he previously MBO’d this very business), we see a take-private as far more feasible than the current market consensus.
Hedges
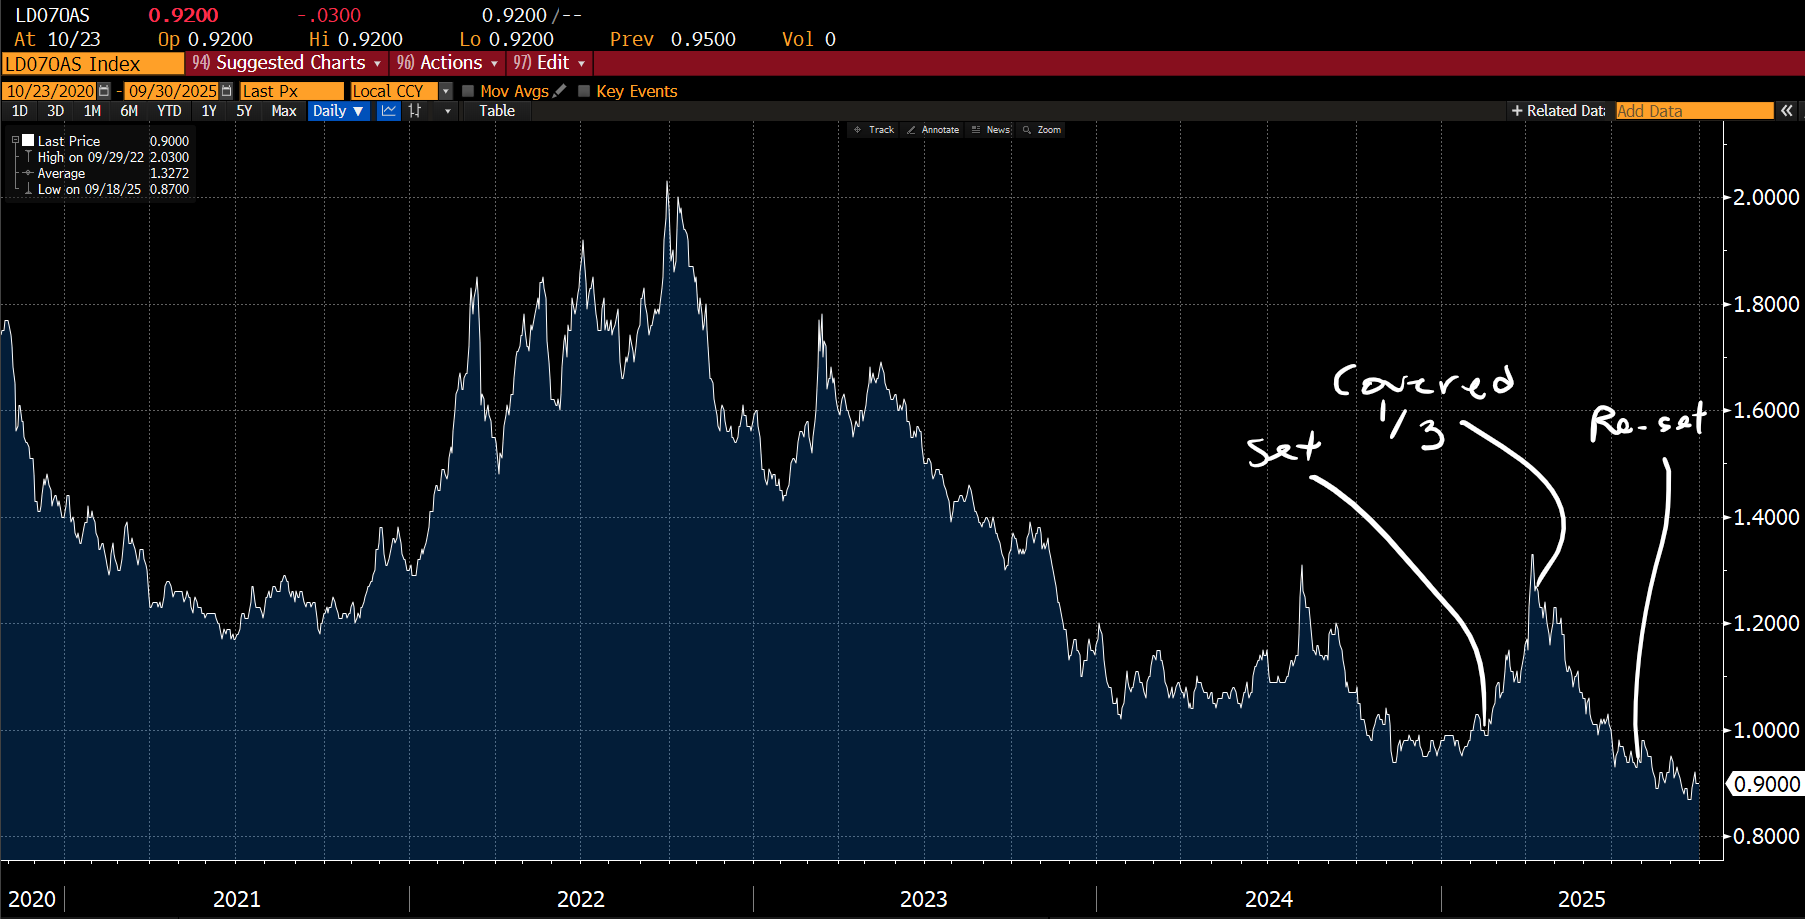
The morning following Trump’s 90-day pause, we covered more than one third of our hedges in investment grade spreads while also letting the hedges dilute as new LP capital joined. Within the quarter, we re-set our investment grade hedge back to 80%. This positioning should provide excellent downside protection in more difficult environments. For example, if spreads of these issuers were to widen by one percentage point (to 2022 levels), the hedge would be expected to contribute more than 10 percentage points of profit.3 The below chart shows the points at which we repositioned our hedges.
Thank you for your investment in the Ewing Morris Select Credit Fund LP.
1. Ewing Morris Select Credit Fund LP returns reflect Class P - Master Series, net of fees and expenses as of September 30,2025. Inception date of the Fund is April 29, 2020. U.S. High Yield Bonds are represented by the iShares U.S. High Yield Bond Index ETF (CAD-Hedged).Canadian Investment Grade Bonds are represented by the iShares Canadian Corporate Bond Index ETF. See Additional Disclosures.
2. Source: Bloomberg, FINRA Trace
3. Based on negative 10.7 CS01 value of the investment grade spread hedge exposure, as of September 30, 2025. Source: Bloomberg.
Performance is based on returns for the Ewing Morris Select Credit Fund LP. Inception date of the strategy is April 29, 2020. As of May 1, 2025 returns are based on Class P, net of fees and expenses. Class P units bear management fees of 0.75% per annum, as well as performance fees, as applicable. From February 1, 2025 to April 30, 2025, returns presented were those of Class S of the Fund, which bear management fees of 0.5% per annum, as well as performance fees, as applicable. Between April 29, 2020 to January 31, 2025 returns are based on a separately managed account, which shared a similar investment objective and strategy as the Ewing Morris Select Credit Fund LP and were calculated net of fees and expenses matching that of Class P. While the Fund’s overall investment objective remains the same, its past performance is not indicative of future performance, and the inclusion of management fees. We have listed the iShares U.S. High Yield Bond Index ETF (CAD-Hedged) and iShares Canadian Corporate Bond Index ETF, as benchmark indices/data for the high yield and corporate bond markets, as these are widely known and used benchmark indices/data for fixed income markets. The Fund has a flexible investment mandate and thus these benchmark indices are provided for information only. Comparisons to these benchmarks and indices have limitations. Investing in fixed income securities is the primary strategy for the Fund, however the Fund does not invest in all, or necessarily any, of the securities that compose the referenced benchmark indices, and the Fund portfolio may contain, among other things, options, short positions and other securities, concentrated levels of securities and may employ leverage not found in these indices. As a result, no market indices are directly comparable to the results of the Fund. Past performance does not guarantee future returns. This letter does not constitute an offer to sell units of any Ewing Morris Fund, collectively, “Ewing Morris Funds”. Units of Ewing Morris Funds are only available to investors who meet investor suitability and sophistication requirements. While information prepared in this report is believed to be accurate, Ewing Morris & Co. Investment Partners Ltd. makes no warranty as to the completeness or accuracy nor can it accept responsibility for errors in the report. This report is not intended for public use or distribution. There can be no guarantee that any projection, forecast or opinion will be realized. All information provided is for informational purposes only and should not be construed as personal investment advice. Users of these materials are advised to conduct their own analysis prior to making any investment decision. Source for data referenced and benchmark information: Capital IQ, Bloomberg and Ewing Morris. As of September 30, 2025.
Fellow Limited Partners,
In the third quarter of 2025, the Select Credit Fund returned +1.9%.This return compares to our publicly traded high yield and investment grade benchmarks, which returned +1.6% and +1.9%, respectively.
Since its inception in 2020, the strategy has delivered a compound annual return of 9.6%.
Performance
Following the liberation day shock and rebound in the second quarter, markets in the third quarter were, by comparison, quite calm and uneventful. Year-to-date, the performance of the Fund has generally matched the broader fixed income space.
The Brief
Portfolio Focus
Top three issuer exposure is at the lower end of its historical range - 39% - spread across telecommunication, enterprise software and healthcare.
Long Exposure
The portfolio’s long exposure in corporate securities is 67%. Since our highest conviction ideas tend to be ‘lumpy’ in both size and timing, this is not unusual. Most of this exposure is in highly tax-efficient investments – 46 percentage points in convertibles (which bear very low coupons) and 9 percentage points in equity exposure.
Equity Exposure
The strategy’s history has seen some (~20%) equity exposure when opportunities are sufficiently abundant. On occasion, we find superior situations in equities where we have credit-driven insight or where we can see optionality for value-unlock through shareholder engagement or M&A. As we have observed costs of credit dropping through the floor in 2025, we have expanded our equity exposure accordingly as we have found opportunities for engagement and takeout optionality. We currently have a 5% weight in Ziff Davis that combines many of these attractive dynamics. Despite trading at 3.5x EBITDA, the company’s debt cost of capital is less than six percent.2 This, combined with shareholder displeasure, resilient underlying business performance and the CEO’s deep experience in private equity (he previously MBO’d this very business), we see a take-private as far more feasible than the current market consensus.
Hedges
The morning following Trump’s 90-day pause, we covered more than one third of our hedges in investment grade spreads while also letting the hedges dilute as new LP capital joined. Within the quarter, we re-set our investment grade hedge back to 80%. This positioning should provide excellent downside protection in more difficult environments. For example, if spreads of these issuers were to widen by one percentage point (to 2022 levels), the hedge would be expected to contribute more than 10 percentage points of profit.3 The below chart shows the points at which we repositioned our hedges.
Thank you for your investment in the Ewing Morris Select Credit Fund LP.
1. Ewing Morris Select Credit Fund LP returns reflect Class P - Master Series, net of fees and expenses as of September 30,2025. Inception date of the Fund is April 29, 2020. U.S. High Yield Bonds are represented by the iShares U.S. High Yield Bond Index ETF (CAD-Hedged).Canadian Investment Grade Bonds are represented by the iShares Canadian Corporate Bond Index ETF. See Additional Disclosures.
2. Source: Bloomberg, FINRA Trace
3. Based on negative 10.7 CS01 value of the investment grade spread hedge exposure, as of September 30, 2025. Source: Bloomberg.
Performance is based on returns for the Ewing Morris Select Credit Fund LP. Inception date of the strategy is April 29, 2020. As of May 1, 2025 returns are based on Class P, net of fees and expenses. Class P units bear management fees of 0.75% per annum, as well as performance fees, as applicable. From February 1, 2025 to April 30, 2025, returns presented were those of Class S of the Fund, which bear management fees of 0.5% per annum, as well as performance fees, as applicable. Between April 29, 2020 to January 31, 2025 returns are based on a separately managed account, which shared a similar investment objective and strategy as the Ewing Morris Select Credit Fund LP and were calculated net of fees and expenses matching that of Class P. While the Fund’s overall investment objective remains the same, its past performance is not indicative of future performance, and the inclusion of management fees. We have listed the iShares U.S. High Yield Bond Index ETF (CAD-Hedged) and iShares Canadian Corporate Bond Index ETF, as benchmark indices/data for the high yield and corporate bond markets, as these are widely known and used benchmark indices/data for fixed income markets. The Fund has a flexible investment mandate and thus these benchmark indices are provided for information only. Comparisons to these benchmarks and indices have limitations. Investing in fixed income securities is the primary strategy for the Fund, however the Fund does not invest in all, or necessarily any, of the securities that compose the referenced benchmark indices, and the Fund portfolio may contain, among other things, options, short positions and other securities, concentrated levels of securities and may employ leverage not found in these indices. As a result, no market indices are directly comparable to the results of the Fund. Past performance does not guarantee future returns. This letter does not constitute an offer to sell units of any Ewing Morris Fund, collectively, “Ewing Morris Funds”. Units of Ewing Morris Funds are only available to investors who meet investor suitability and sophistication requirements. While information prepared in this report is believed to be accurate, Ewing Morris & Co. Investment Partners Ltd. makes no warranty as to the completeness or accuracy nor can it accept responsibility for errors in the report. This report is not intended for public use or distribution. There can be no guarantee that any projection, forecast or opinion will be realized. All information provided is for informational purposes only and should not be construed as personal investment advice. Users of these materials are advised to conduct their own analysis prior to making any investment decision. Source for data referenced and benchmark information: Capital IQ, Bloomberg and Ewing Morris. As of September 30, 2025.

Minimizing Tax Drag (Part 2)
Any tax-conscious investor should be transfixed by the opportunities (and pitfalls) in fixed income. This is our account of the landscape.

Schedule a
Conversation


Connect with Peers


Explore Our Full Library


Library


Minimizing Tax Drag (Part 2)