To the Limited Partners of the Ewing Morris Flexible Fixed Income Fund:
Our Performance in 2022
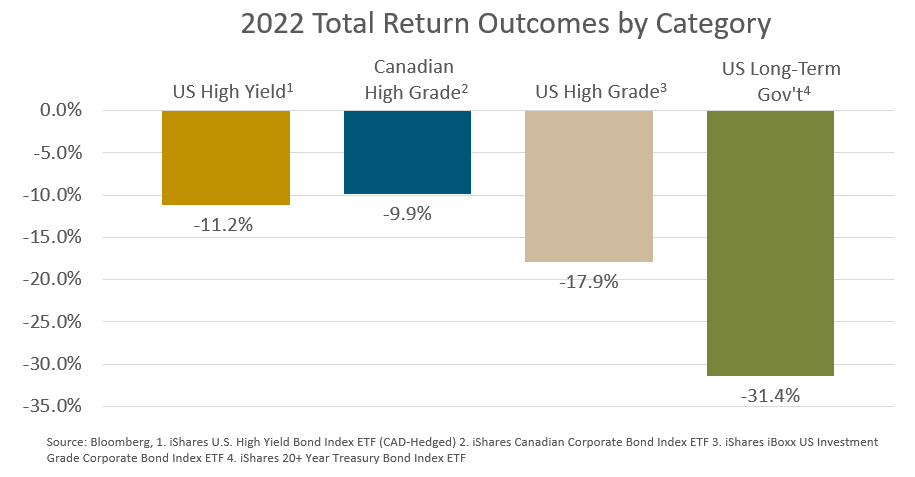
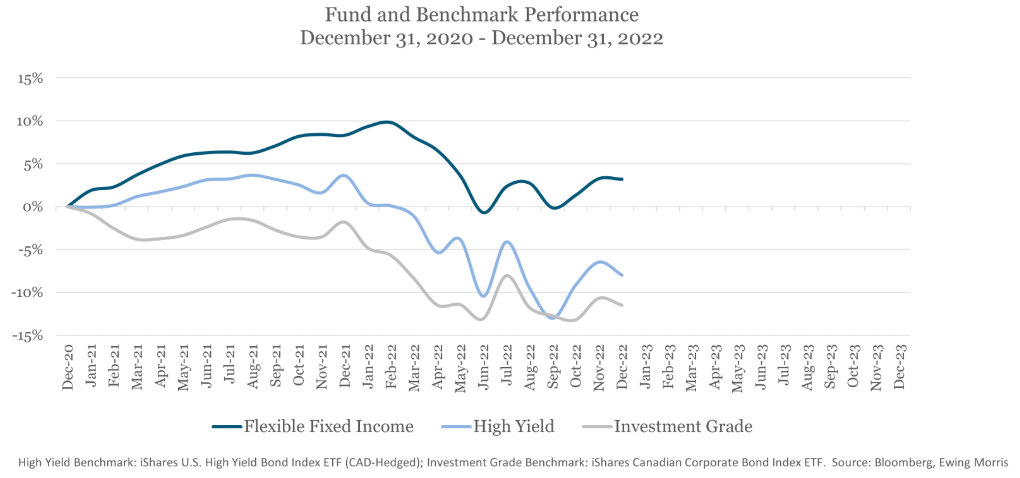
In 2022, the Flexible Fixed Income Fund Returned -4.7%. This return compares to our publicly traded high yield and investment grade benchmarks, which in 2022 returned -11.2% and -9.9% respectively.
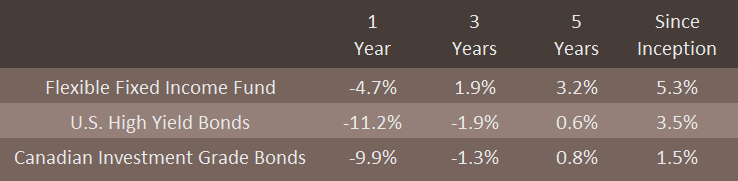
Ewing Morris Flexible Fixed Income Fund LP returns reflect Class P - Master Series, net of fees and expenses as of December 31, 2022. Inception date of the Fund is February 1, 2016. U.S. High Yield Bonds are represented by the iShares U.S. High Yield Bond Index ETF(CAD-Hedged). Canadian Investment Grade Bonds are represented by the iShares Canadian Corporate Bond Index ETF.
Everyone knows what happened in2022. Interest rates soared and many argue that we have crossed the Rubicon into a new geopolitical, economic and monetary regime. It was the worst year for bonds in a generation.
Having lost money in 2022, we cannot help but to be disappointed with the outcome in absolute terms. The counterbalance to this is the Fund outperformed its benchmark by 6.5 percentage points – the largest gap in the history of the fund. We can also put this relative performance in an absolute return context - since the inception of the high yield market index, 36 years ago, a 6.5 percentage point value-add would have been sufficient to produce a positive absolute return in any calendar year other than 2008. In a phrase, the year was “passable but insufficient.”
Performance: Puts and Takes
Performance detractors were, unsurprisingly, broad-based as even short-term risk-free bonds suffered in price1. However, the convertible bond sector is where the fund saw its largest individual losses. As we have found great promise in the convertible bond market in 2022, about 40% of fund capital is invested in this space. With a number of investments in this space, there were negative contributors. In one case, we misjudged management’s orientation toward creditors (Dye & Durham, which cost the fund 1.0%). In another case, we bought what we believe is an eventual par outcome at a purchase price in the low 70’s, only to see the convertible sink into the mid 50’s on tightness in funding markets and consumer concerns (Affirm, which cost the fund 1.2%). And, in another case the decline of a convertible bond that has immense long-term equity optionality to levels we believe are exceptionally cheap (Ziff Davis, which cost the fund 1.2%). In sum, positions in these three companies detracted 3.5 percentage points of return. And, when including Coinbase (which still sports zero net debt and bonds in the 50’s), the rake-stepping tally rises into the 5% range. Your Portfolio Manager will not offer any excuses for these negative outcomes.
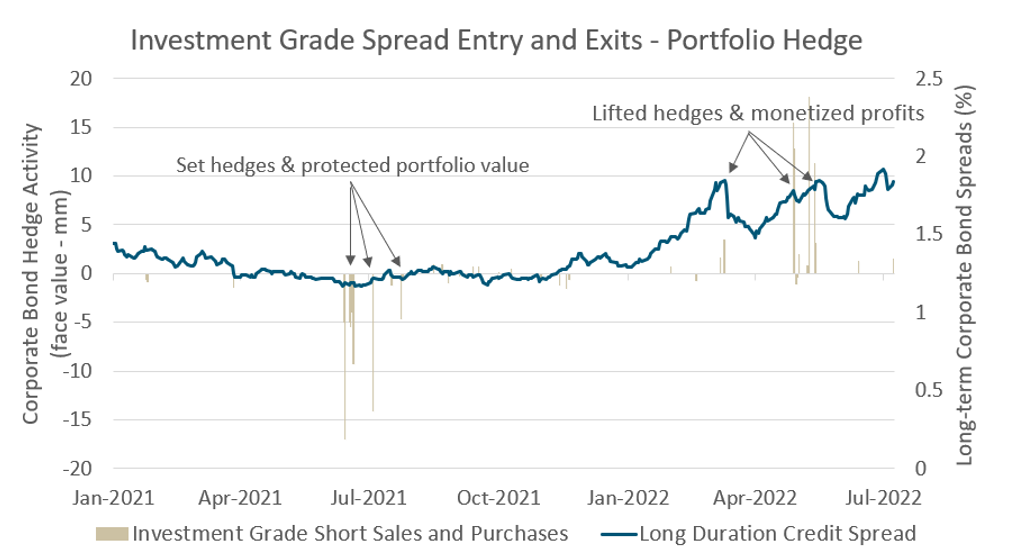
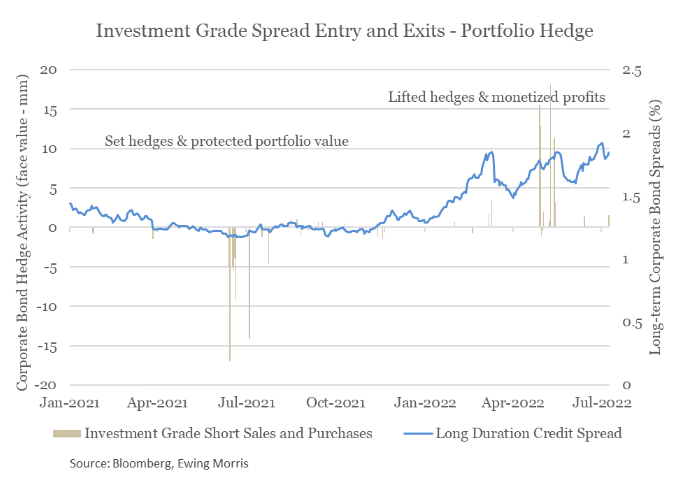
The greatest positive single contributor to results in 2022 was a broad credit hedge we put in place in Q3 of 2021, which paid off in the first half of the year as rates shot up and high-grade credit markets weakened. In 2021, we identified the possibility that inflation may end up pressuring the credit market, which at the time carried prices that implied very little expectation of future inflation (or even economic weakness). Seeing this setup as a near “free” option to insulate the portfolio from stormy financial conditions, we shorted the (record expensive) credit risk of long-term corporate bonds on the view that inflation (and its consequent central bank tightening) would ultimately impact stock and credit prices. This hedge was executed on a diversified basis (largely through electronic ‘portfolio trades’) and was the greatest contributor to our preservation of capital from 2021 to mid 2022. In 2022, this position added 5.2 percentage points of return to the fund.
We also saw success in 2022 in our Structural Value investments. These are investments where the investment outcome is driven by features of the bond contract rather than by business performance or its management team’s credit stewardship.
Profitable investing requires asymmetry. Asymmetry in information and asymmetry in insight are conditions for potential asymmetry in investment outcome. We are seeing Structural Value positions tied to corporate events as an investment category that is among the most asymmetry-rich spaces that we can find in the market. For a variety of circumstances, companies from time-to-time consider corporate events such as reorganizations, mergers or sales, which can have profound implications on their bonds. The economic consequences to the bonds are driven by what’s contained in each bond contract. Recognizing and monetizing this type of opportunity requires integrating governance-based pattern recognition, real-world industrial logic and debt contract analysis. Without this analytical combination, a bond may appear like any other when - in substance - it is not.
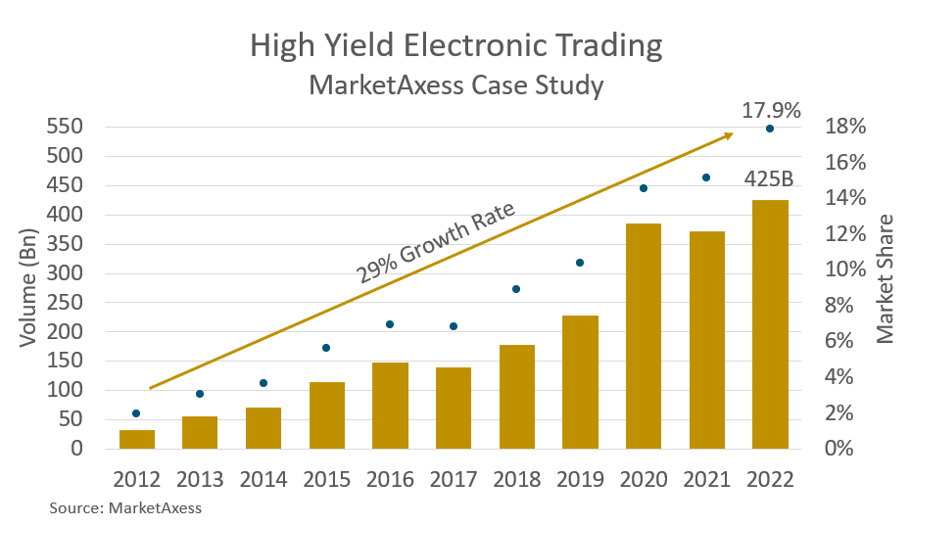
Although the total profit pool of this investment category is substantial, the problem is that it requires decision makers to personally have (or have immediately available to them) this disparate combination of skillsets. Because of this challenge, this event-driven profit pool is not a focal point for large fixed income managers. The interesting question is “Why”? As a practical matter in a race to the bottom on fees, the average capital deployed per investment professional has ballooned over time, forcing fixed income asset manager research departments to focus only on the most readily accessible profit pools, being credit quality, duration and sector. Compounding this theme, large asset managers are increasingly managing their portfolios through electronic venues and more commonly using “portfolio trades”, targeting baskets of a specified credit quality, duration and sector. Under this approach, special situations in any specific bond in the basket does not matter as much to a decision maker as the characteristic and pricing of the basket that is being traded.
This dynamic opens the opportunity for asymmetric engagement in markets of corporate debt securities. This became strikingly apparent to us in certain situations we monetized in 2021, the Shaw Communication Preferred Shares2 being the standout example of this. We dedicated significant resources to this area in 2022 due to its profitability and continued promise in a fixed income landscape that is becoming more quantitatively driven.
Bond trading has clearly turned more electronic (as opposed to in Bloomberg chat or over the phone). We have noticed a marked increase in the prevalence of automated pricing and algorithm-driven counterparties on electronic trading venues. These players often trade based on descriptive statistics and relative value of a bond. If this is the case, this trend may actually deepen this event-driven profit pool in the future. We look forward to finding out.
The Current Situation
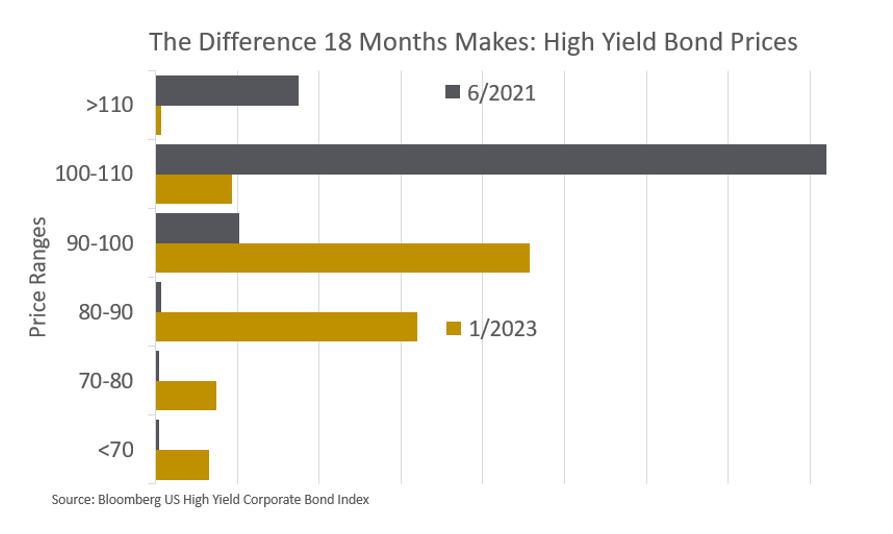
For the first time in more than a decade, we are seeing a sustained and strikingly wide range in pricing in the bond market. One needs to look no further than some bonds of Google, which trade at 60 cents on the dollar to find proof of this3. It’s not lost upon us that swathes of high yield and high-grade bonds are now trading at “recovery value” prices, despite good credit quality. Due to the swift move higher in yields, the current situation is one that we have scarcely seen in the history of corporate bond markets. As the below figure shows, the overwhelming majority of bonds in 2021 were found in the 100-110 price range. Today the most common bond prices start with an ‘8’ or a ‘9’. There are also more bonds priced below 80 than there are bonds priced above par (100). Up until 2022, the bond market was a fairly simple offering - chocolate or vanilla. Today, the market is a veritable Baskin Robbins and we are active, scoop and waffle cones in hand.
A Note on Our Fixed Income Investment Operation
In a year like 2022, it is easy to become captive to market moves and macro narratives, which threaten to distract us from keeping the main thing the main thing. To guard against getting carried away by these dynamics, we remind ourselves of the essence of our task at hand. This reminder may be also helpful to you. In its most simple form, our operation buys claims on North American business. We exchange capital today for well-defined promises of the repayment of more capital tomorrow. These promises are debt contracts backed by North American business. Importantly, the promises that we buy do not require the financial success of a business. These promises simply require a lack of failure. The debt contracts of these businesses trade in the market at prices that the market sets on any given day. Importantly, prices for individual debt contracts occasionally become divorced from their true value. This “dislocation” tends to be driven by inaccurate assessments of the business’ resilience, people running or governing the business or the contractual features of the debt itself. Sometimes dislocations are even more simple, when the owners of the debt contracts see what everyone else sees, but nonetheless have to sell the debt anyway. Regardless of circumstance, it is our job to accurately identify truly dislocated situations and make informed purchases and sales based on our investment insight. Your financial success with us will be defined by the accuracy of our decisions. If the cumulative accuracy of our decisions is superior, results will exceed our fixed income benchmarks over the long-term. It should be noted that it is possible for performance track records to deviate from underlying skill. However, as time passes, Bill Parcells’s4 message on track record becomes indisputable: “You are what your record says you are.”
Outlook
As of this writing, the high yield default cycle has yet to truly arrive. Many observers are calling for rough performance in the asset class on account of their view that the additional yield high yield bonds offer over risk free government bonds (known as the credit spread) is insufficient. We very much appreciate this perspective and even after the strong start to the year (+3.4%)5 we wouldn’t be surprised to see the asset class down in moments in 2023, perhaps materially. However, in a circumstance such as this where high yield finds itself back near or into double digit yield territory (from it’s current 8% level), we would likely view this as an opportunity of a cycle. However, expecting or betting on that to happen is to discount the history of high yield performance. It is striking to note that high yield bonds have never seen consecutive down (calendar) years in its recorded history. As the opportunity set is strong and it is impossible to predict the zig-zags of the market, we remain fully invested and are ready to deploy capital with agility when situations and market circumstances justify.
Thank you for your investment in the Ewing Morris Flexible Fixed Income Fund.
1 Source: Bloomberg - sample short-term US Treasury Note (ie: T 1.5% due 11/2024) returned negative 5.5% in 2022.
2Average purchase price of $19.71 (post-announcement) versus redemption price of $25.00
3Source: Bloomberg - GOOGL 2.25% due 2060. These notes traded as low as 52 cents in 2022.
4Bill Parcells: the only NFL coach to lead four different franchises to the playoffs and three to a conference championship game. In four years, he lead the New York Giants - a team that when he joined had only one year with a winning record in their last ten - to win a Super Bowl championship.
5As of January 17, 2023
Inception date of the Flexible Fixed Income Fund is February 1, 2016. Flexible Fixed Income Fund returns reflect Class P - Master Series, net of fees and expenses. We have listed the iShares U.S. High Yield Bond Index ETF (CAD-Hedged), iShares Canadian Corporate Bond Index ETF, Barclays US High Yield Corporate Bond Index Yield and Barclays US Corporate Bond Index Yield as benchmark indices as these are widely known and used benchmark indices for fixed income markets. The Fund has a flexible investment mandate and thus these benchmark indices are provided for information only. Comparisons to benchmarks and indices have limitations. The Fund does not invest in all, or necessarily any, of the securities that compose the referenced benchmark indices, and the Fund portfolio may contain, among other things, options, short positions and other securities, concentrated levels of securities and may employ leverage not found in these indices. As a result, no market indices are directly comparable to the results of the Fund. Past performance does not guarantee future returns. This letter does not constitute an offer to sell units of any Ewing Morris Fund, collectively, “Ewing Morris Funds”. Units of Ewing Morris Funds are only available to investors who meet investor suitability and sophistication requirements. While information prepared in this report is believed to be accurate, Ewing Morris & Co. Investment Partners Ltd. makes no warranty as to the completeness or accuracy nor can it accept responsibility for errors in the report. This report is not intended for public use or distribution. There can be no guarantee that any projection, forecast or opinion will be realized. All information provided is for informational purposes only and should not be construed as personal investment advice. Users of these materials are advised to conduct their own analysis prior to making any investment decision. Source: Capital IQ, Bloomberg and Ewing Morris. As of December 31, 2022.
To the Limited Partners of the Ewing Morris Flexible Fixed Income Fund:
Our Performance in 2022
In 2022, the Flexible Fixed Income Fund Returned -4.7%. This return compares to our publicly traded high yield and investment grade benchmarks, which in 2022 returned -11.2% and -9.9% respectively.
Ewing Morris Flexible Fixed Income Fund LP returns reflect Class P - Master Series, net of fees and expenses as of December 31, 2022. Inception date of the Fund is February 1, 2016. U.S. High Yield Bonds are represented by the iShares U.S. High Yield Bond Index ETF(CAD-Hedged). Canadian Investment Grade Bonds are represented by the iShares Canadian Corporate Bond Index ETF.
Everyone knows what happened in2022. Interest rates soared and many argue that we have crossed the Rubicon into a new geopolitical, economic and monetary regime. It was the worst year for bonds in a generation.
Having lost money in 2022, we cannot help but to be disappointed with the outcome in absolute terms. The counterbalance to this is the Fund outperformed its benchmark by 6.5 percentage points – the largest gap in the history of the fund. We can also put this relative performance in an absolute return context - since the inception of the high yield market index, 36 years ago, a 6.5 percentage point value-add would have been sufficient to produce a positive absolute return in any calendar year other than 2008. In a phrase, the year was “passable but insufficient.”
Performance: Puts and Takes
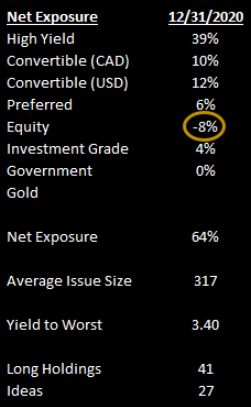
Performance detractors were, unsurprisingly, broad-based as even short-term risk-free bonds suffered in price1. However, the convertible bond sector is where the fund saw its largest individual losses. As we have found great promise in the convertible bond market in 2022, about 40% of fund capital is invested in this space. With a number of investments in this space, there were negative contributors. In one case, we misjudged management’s orientation toward creditors (Dye & Durham, which cost the fund 1.0%). In another case, we bought what we believe is an eventual par outcome at a purchase price in the low 70’s, only to see the convertible sink into the mid 50’s on tightness in funding markets and consumer concerns (Affirm, which cost the fund 1.2%). And, in another case the decline of a convertible bond that has immense long-term equity optionality to levels we believe are exceptionally cheap (Ziff Davis, which cost the fund 1.2%). In sum, positions in these three companies detracted 3.5 percentage points of return. And, when including Coinbase (which still sports zero net debt and bonds in the 50’s), the rake-stepping tally rises into the 5% range. Your Portfolio Manager will not offer any excuses for these negative outcomes.
The greatest positive single contributor to results in 2022 was a broad credit hedge we put in place in Q3 of 2021, which paid off in the first half of the year as rates shot up and high-grade credit markets weakened. In 2021, we identified the possibility that inflation may end up pressuring the credit market, which at the time carried prices that implied very little expectation of future inflation (or even economic weakness). Seeing this setup as a near “free” option to insulate the portfolio from stormy financial conditions, we shorted the (record expensive) credit risk of long-term corporate bonds on the view that inflation (and its consequent central bank tightening) would ultimately impact stock and credit prices. This hedge was executed on a diversified basis (largely through electronic ‘portfolio trades’) and was the greatest contributor to our preservation of capital from 2021 to mid 2022. In 2022, this position added 5.2 percentage points of return to the fund.
We also saw success in 2022 in our Structural Value investments. These are investments where the investment outcome is driven by features of the bond contract rather than by business performance or its management team’s credit stewardship.
Profitable investing requires asymmetry. Asymmetry in information and asymmetry in insight are conditions for potential asymmetry in investment outcome. We are seeing Structural Value positions tied to corporate events as an investment category that is among the most asymmetry-rich spaces that we can find in the market. For a variety of circumstances, companies from time-to-time consider corporate events such as reorganizations, mergers or sales, which can have profound implications on their bonds. The economic consequences to the bonds are driven by what’s contained in each bond contract. Recognizing and monetizing this type of opportunity requires integrating governance-based pattern recognition, real-world industrial logic and debt contract analysis. Without this analytical combination, a bond may appear like any other when - in substance - it is not.
Although the total profit pool of this investment category is substantial, the problem is that it requires decision makers to personally have (or have immediately available to them) this disparate combination of skillsets. Because of this challenge, this event-driven profit pool is not a focal point for large fixed income managers. The interesting question is “Why”? As a practical matter in a race to the bottom on fees, the average capital deployed per investment professional has ballooned over time, forcing fixed income asset manager research departments to focus only on the most readily accessible profit pools, being credit quality, duration and sector. Compounding this theme, large asset managers are increasingly managing their portfolios through electronic venues and more commonly using “portfolio trades”, targeting baskets of a specified credit quality, duration and sector. Under this approach, special situations in any specific bond in the basket does not matter as much to a decision maker as the characteristic and pricing of the basket that is being traded.
This dynamic opens the opportunity for asymmetric engagement in markets of corporate debt securities. This became strikingly apparent to us in certain situations we monetized in 2021, the Shaw Communication Preferred Shares2 being the standout example of this. We dedicated significant resources to this area in 2022 due to its profitability and continued promise in a fixed income landscape that is becoming more quantitatively driven.
Bond trading has clearly turned more electronic (as opposed to in Bloomberg chat or over the phone). We have noticed a marked increase in the prevalence of automated pricing and algorithm-driven counterparties on electronic trading venues. These players often trade based on descriptive statistics and relative value of a bond. If this is the case, this trend may actually deepen this event-driven profit pool in the future. We look forward to finding out.
The Current Situation
For the first time in more than a decade, we are seeing a sustained and strikingly wide range in pricing in the bond market. One needs to look no further than some bonds of Google, which trade at 60 cents on the dollar to find proof of this3. It’s not lost upon us that swathes of high yield and high-grade bonds are now trading at “recovery value” prices, despite good credit quality. Due to the swift move higher in yields, the current situation is one that we have scarcely seen in the history of corporate bond markets. As the below figure shows, the overwhelming majority of bonds in 2021 were found in the 100-110 price range. Today the most common bond prices start with an ‘8’ or a ‘9’. There are also more bonds priced below 80 than there are bonds priced above par (100). Up until 2022, the bond market was a fairly simple offering - chocolate or vanilla. Today, the market is a veritable Baskin Robbins and we are active, scoop and waffle cones in hand.
A Note on Our Fixed Income Investment Operation
In a year like 2022, it is easy to become captive to market moves and macro narratives, which threaten to distract us from keeping the main thing the main thing. To guard against getting carried away by these dynamics, we remind ourselves of the essence of our task at hand. This reminder may be also helpful to you. In its most simple form, our operation buys claims on North American business. We exchange capital today for well-defined promises of the repayment of more capital tomorrow. These promises are debt contracts backed by North American business. Importantly, the promises that we buy do not require the financial success of a business. These promises simply require a lack of failure. The debt contracts of these businesses trade in the market at prices that the market sets on any given day. Importantly, prices for individual debt contracts occasionally become divorced from their true value. This “dislocation” tends to be driven by inaccurate assessments of the business’ resilience, people running or governing the business or the contractual features of the debt itself. Sometimes dislocations are even more simple, when the owners of the debt contracts see what everyone else sees, but nonetheless have to sell the debt anyway. Regardless of circumstance, it is our job to accurately identify truly dislocated situations and make informed purchases and sales based on our investment insight. Your financial success with us will be defined by the accuracy of our decisions. If the cumulative accuracy of our decisions is superior, results will exceed our fixed income benchmarks over the long-term. It should be noted that it is possible for performance track records to deviate from underlying skill. However, as time passes, Bill Parcells’s4 message on track record becomes indisputable: “You are what your record says you are.”
Outlook
As of this writing, the high yield default cycle has yet to truly arrive. Many observers are calling for rough performance in the asset class on account of their view that the additional yield high yield bonds offer over risk free government bonds (known as the credit spread) is insufficient. We very much appreciate this perspective and even after the strong start to the year (+3.4%)5 we wouldn’t be surprised to see the asset class down in moments in 2023, perhaps materially. However, in a circumstance such as this where high yield finds itself back near or into double digit yield territory (from it’s current 8% level), we would likely view this as an opportunity of a cycle. However, expecting or betting on that to happen is to discount the history of high yield performance. It is striking to note that high yield bonds have never seen consecutive down (calendar) years in its recorded history. As the opportunity set is strong and it is impossible to predict the zig-zags of the market, we remain fully invested and are ready to deploy capital with agility when situations and market circumstances justify.
Thank you for your investment in the Ewing Morris Flexible Fixed Income Fund.
1 Source: Bloomberg - sample short-term US Treasury Note (ie: T 1.5% due 11/2024) returned negative 5.5% in 2022.
2Average purchase price of $19.71 (post-announcement) versus redemption price of $25.00
3Source: Bloomberg - GOOGL 2.25% due 2060. These notes traded as low as 52 cents in 2022.
4Bill Parcells: the only NFL coach to lead four different franchises to the playoffs and three to a conference championship game. In four years, he lead the New York Giants - a team that when he joined had only one year with a winning record in their last ten - to win a Super Bowl championship.
5As of January 17, 2023
Inception date of the Flexible Fixed Income Fund is February 1, 2016. Flexible Fixed Income Fund returns reflect Class P - Master Series, net of fees and expenses. We have listed the iShares U.S. High Yield Bond Index ETF (CAD-Hedged), iShares Canadian Corporate Bond Index ETF, Barclays US High Yield Corporate Bond Index Yield and Barclays US Corporate Bond Index Yield as benchmark indices as these are widely known and used benchmark indices for fixed income markets. The Fund has a flexible investment mandate and thus these benchmark indices are provided for information only. Comparisons to benchmarks and indices have limitations. The Fund does not invest in all, or necessarily any, of the securities that compose the referenced benchmark indices, and the Fund portfolio may contain, among other things, options, short positions and other securities, concentrated levels of securities and may employ leverage not found in these indices. As a result, no market indices are directly comparable to the results of the Fund. Past performance does not guarantee future returns. This letter does not constitute an offer to sell units of any Ewing Morris Fund, collectively, “Ewing Morris Funds”. Units of Ewing Morris Funds are only available to investors who meet investor suitability and sophistication requirements. While information prepared in this report is believed to be accurate, Ewing Morris & Co. Investment Partners Ltd. makes no warranty as to the completeness or accuracy nor can it accept responsibility for errors in the report. This report is not intended for public use or distribution. There can be no guarantee that any projection, forecast or opinion will be realized. All information provided is for informational purposes only and should not be construed as personal investment advice. Users of these materials are advised to conduct their own analysis prior to making any investment decision. Source: Capital IQ, Bloomberg and Ewing Morris. As of December 31, 2022.
To the Limited Partners of the Ewing Morris Flexible Fixed Income Fund:
Our Performance in 2022
In 2022, the Flexible Fixed Income Fund Returned -4.7%. This return compares to our publicly traded high yield and investment grade benchmarks, which in 2022 returned -11.2% and -9.9% respectively.
Ewing Morris Flexible Fixed Income Fund LP returns reflect Class P - Master Series, net of fees and expenses as of December 31, 2022. Inception date of the Fund is February 1, 2016. U.S. High Yield Bonds are represented by the iShares U.S. High Yield Bond Index ETF(CAD-Hedged). Canadian Investment Grade Bonds are represented by the iShares Canadian Corporate Bond Index ETF.
Everyone knows what happened in2022. Interest rates soared and many argue that we have crossed the Rubicon into a new geopolitical, economic and monetary regime. It was the worst year for bonds in a generation.
Having lost money in 2022, we cannot help but to be disappointed with the outcome in absolute terms. The counterbalance to this is the Fund outperformed its benchmark by 6.5 percentage points – the largest gap in the history of the fund. We can also put this relative performance in an absolute return context - since the inception of the high yield market index, 36 years ago, a 6.5 percentage point value-add would have been sufficient to produce a positive absolute return in any calendar year other than 2008. In a phrase, the year was “passable but insufficient.”
Performance: Puts and Takes
Performance detractors were, unsurprisingly, broad-based as even short-term risk-free bonds suffered in price1. However, the convertible bond sector is where the fund saw its largest individual losses. As we have found great promise in the convertible bond market in 2022, about 40% of fund capital is invested in this space. With a number of investments in this space, there were negative contributors. In one case, we misjudged management’s orientation toward creditors (Dye & Durham, which cost the fund 1.0%). In another case, we bought what we believe is an eventual par outcome at a purchase price in the low 70’s, only to see the convertible sink into the mid 50’s on tightness in funding markets and consumer concerns (Affirm, which cost the fund 1.2%). And, in another case the decline of a convertible bond that has immense long-term equity optionality to levels we believe are exceptionally cheap (Ziff Davis, which cost the fund 1.2%). In sum, positions in these three companies detracted 3.5 percentage points of return. And, when including Coinbase (which still sports zero net debt and bonds in the 50’s), the rake-stepping tally rises into the 5% range. Your Portfolio Manager will not offer any excuses for these negative outcomes.
The greatest positive single contributor to results in 2022 was a broad credit hedge we put in place in Q3 of 2021, which paid off in the first half of the year as rates shot up and high-grade credit markets weakened. In 2021, we identified the possibility that inflation may end up pressuring the credit market, which at the time carried prices that implied very little expectation of future inflation (or even economic weakness). Seeing this setup as a near “free” option to insulate the portfolio from stormy financial conditions, we shorted the (record expensive) credit risk of long-term corporate bonds on the view that inflation (and its consequent central bank tightening) would ultimately impact stock and credit prices. This hedge was executed on a diversified basis (largely through electronic ‘portfolio trades’) and was the greatest contributor to our preservation of capital from 2021 to mid 2022. In 2022, this position added 5.2 percentage points of return to the fund.
We also saw success in 2022 in our Structural Value investments. These are investments where the investment outcome is driven by features of the bond contract rather than by business performance or its management team’s credit stewardship.
Profitable investing requires asymmetry. Asymmetry in information and asymmetry in insight are conditions for potential asymmetry in investment outcome. We are seeing Structural Value positions tied to corporate events as an investment category that is among the most asymmetry-rich spaces that we can find in the market. For a variety of circumstances, companies from time-to-time consider corporate events such as reorganizations, mergers or sales, which can have profound implications on their bonds. The economic consequences to the bonds are driven by what’s contained in each bond contract. Recognizing and monetizing this type of opportunity requires integrating governance-based pattern recognition, real-world industrial logic and debt contract analysis. Without this analytical combination, a bond may appear like any other when - in substance - it is not.
Although the total profit pool of this investment category is substantial, the problem is that it requires decision makers to personally have (or have immediately available to them) this disparate combination of skillsets. Because of this challenge, this event-driven profit pool is not a focal point for large fixed income managers. The interesting question is “Why”? As a practical matter in a race to the bottom on fees, the average capital deployed per investment professional has ballooned over time, forcing fixed income asset manager research departments to focus only on the most readily accessible profit pools, being credit quality, duration and sector. Compounding this theme, large asset managers are increasingly managing their portfolios through electronic venues and more commonly using “portfolio trades”, targeting baskets of a specified credit quality, duration and sector. Under this approach, special situations in any specific bond in the basket does not matter as much to a decision maker as the characteristic and pricing of the basket that is being traded.
This dynamic opens the opportunity for asymmetric engagement in markets of corporate debt securities. This became strikingly apparent to us in certain situations we monetized in 2021, the Shaw Communication Preferred Shares2 being the standout example of this. We dedicated significant resources to this area in 2022 due to its profitability and continued promise in a fixed income landscape that is becoming more quantitatively driven.
Bond trading has clearly turned more electronic (as opposed to in Bloomberg chat or over the phone). We have noticed a marked increase in the prevalence of automated pricing and algorithm-driven counterparties on electronic trading venues. These players often trade based on descriptive statistics and relative value of a bond. If this is the case, this trend may actually deepen this event-driven profit pool in the future. We look forward to finding out.
The Current Situation
For the first time in more than a decade, we are seeing a sustained and strikingly wide range in pricing in the bond market. One needs to look no further than some bonds of Google, which trade at 60 cents on the dollar to find proof of this3. It’s not lost upon us that swathes of high yield and high-grade bonds are now trading at “recovery value” prices, despite good credit quality. Due to the swift move higher in yields, the current situation is one that we have scarcely seen in the history of corporate bond markets. As the below figure shows, the overwhelming majority of bonds in 2021 were found in the 100-110 price range. Today the most common bond prices start with an ‘8’ or a ‘9’. There are also more bonds priced below 80 than there are bonds priced above par (100). Up until 2022, the bond market was a fairly simple offering - chocolate or vanilla. Today, the market is a veritable Baskin Robbins and we are active, scoop and waffle cones in hand.
A Note on Our Fixed Income Investment Operation
In a year like 2022, it is easy to become captive to market moves and macro narratives, which threaten to distract us from keeping the main thing the main thing. To guard against getting carried away by these dynamics, we remind ourselves of the essence of our task at hand. This reminder may be also helpful to you. In its most simple form, our operation buys claims on North American business. We exchange capital today for well-defined promises of the repayment of more capital tomorrow. These promises are debt contracts backed by North American business. Importantly, the promises that we buy do not require the financial success of a business. These promises simply require a lack of failure. The debt contracts of these businesses trade in the market at prices that the market sets on any given day. Importantly, prices for individual debt contracts occasionally become divorced from their true value. This “dislocation” tends to be driven by inaccurate assessments of the business’ resilience, people running or governing the business or the contractual features of the debt itself. Sometimes dislocations are even more simple, when the owners of the debt contracts see what everyone else sees, but nonetheless have to sell the debt anyway. Regardless of circumstance, it is our job to accurately identify truly dislocated situations and make informed purchases and sales based on our investment insight. Your financial success with us will be defined by the accuracy of our decisions. If the cumulative accuracy of our decisions is superior, results will exceed our fixed income benchmarks over the long-term. It should be noted that it is possible for performance track records to deviate from underlying skill. However, as time passes, Bill Parcells’s4 message on track record becomes indisputable: “You are what your record says you are.”
Outlook
As of this writing, the high yield default cycle has yet to truly arrive. Many observers are calling for rough performance in the asset class on account of their view that the additional yield high yield bonds offer over risk free government bonds (known as the credit spread) is insufficient. We very much appreciate this perspective and even after the strong start to the year (+3.4%)5 we wouldn’t be surprised to see the asset class down in moments in 2023, perhaps materially. However, in a circumstance such as this where high yield finds itself back near or into double digit yield territory (from it’s current 8% level), we would likely view this as an opportunity of a cycle. However, expecting or betting on that to happen is to discount the history of high yield performance. It is striking to note that high yield bonds have never seen consecutive down (calendar) years in its recorded history. As the opportunity set is strong and it is impossible to predict the zig-zags of the market, we remain fully invested and are ready to deploy capital with agility when situations and market circumstances justify.
Thank you for your investment in the Ewing Morris Flexible Fixed Income Fund.
1 Source: Bloomberg - sample short-term US Treasury Note (ie: T 1.5% due 11/2024) returned negative 5.5% in 2022.
2Average purchase price of $19.71 (post-announcement) versus redemption price of $25.00
3Source: Bloomberg - GOOGL 2.25% due 2060. These notes traded as low as 52 cents in 2022.
4Bill Parcells: the only NFL coach to lead four different franchises to the playoffs and three to a conference championship game. In four years, he lead the New York Giants - a team that when he joined had only one year with a winning record in their last ten - to win a Super Bowl championship.
5As of January 17, 2023
Inception date of the Flexible Fixed Income Fund is February 1, 2016. Flexible Fixed Income Fund returns reflect Class P - Master Series, net of fees and expenses. We have listed the iShares U.S. High Yield Bond Index ETF (CAD-Hedged), iShares Canadian Corporate Bond Index ETF, Barclays US High Yield Corporate Bond Index Yield and Barclays US Corporate Bond Index Yield as benchmark indices as these are widely known and used benchmark indices for fixed income markets. The Fund has a flexible investment mandate and thus these benchmark indices are provided for information only. Comparisons to benchmarks and indices have limitations. The Fund does not invest in all, or necessarily any, of the securities that compose the referenced benchmark indices, and the Fund portfolio may contain, among other things, options, short positions and other securities, concentrated levels of securities and may employ leverage not found in these indices. As a result, no market indices are directly comparable to the results of the Fund. Past performance does not guarantee future returns. This letter does not constitute an offer to sell units of any Ewing Morris Fund, collectively, “Ewing Morris Funds”. Units of Ewing Morris Funds are only available to investors who meet investor suitability and sophistication requirements. While information prepared in this report is believed to be accurate, Ewing Morris & Co. Investment Partners Ltd. makes no warranty as to the completeness or accuracy nor can it accept responsibility for errors in the report. This report is not intended for public use or distribution. There can be no guarantee that any projection, forecast or opinion will be realized. All information provided is for informational purposes only and should not be construed as personal investment advice. Users of these materials are advised to conduct their own analysis prior to making any investment decision. Source: Capital IQ, Bloomberg and Ewing Morris. As of December 31, 2022.

2023 Annual Letter
To the Limited Partners of the Ewing Morris Flexible Fixed Income Fund:
If 2023 had a theme, Growth was it. In 2023, we grew your capital. Our capacity to create value in credit also grew. But these are just words on a page. Let's explore the facts on the ground.
Growing Your Capital in 2023
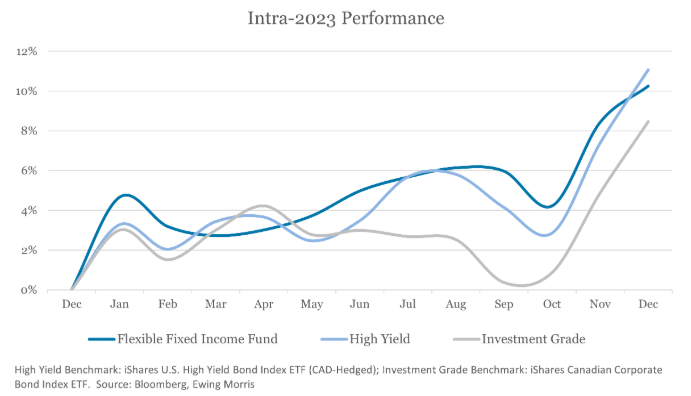
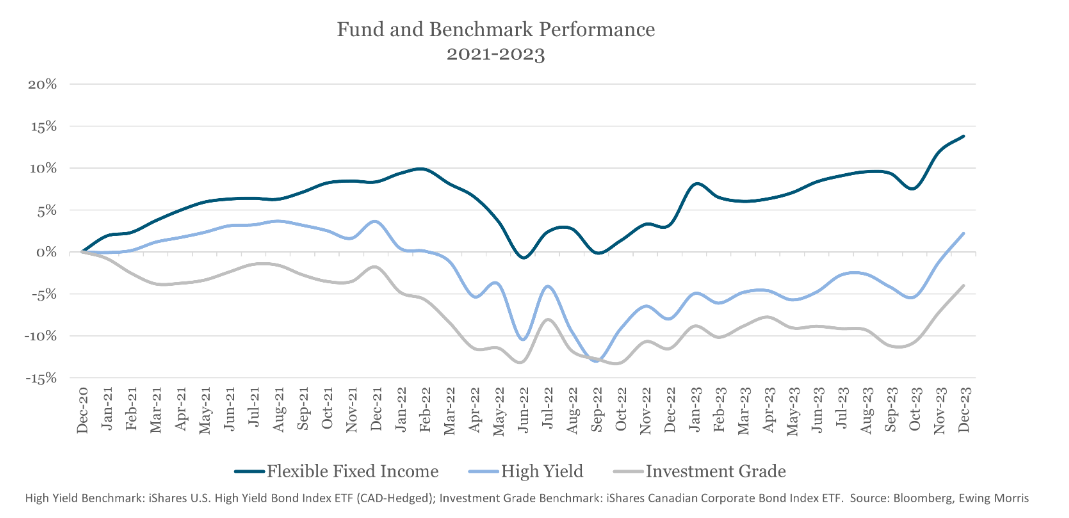
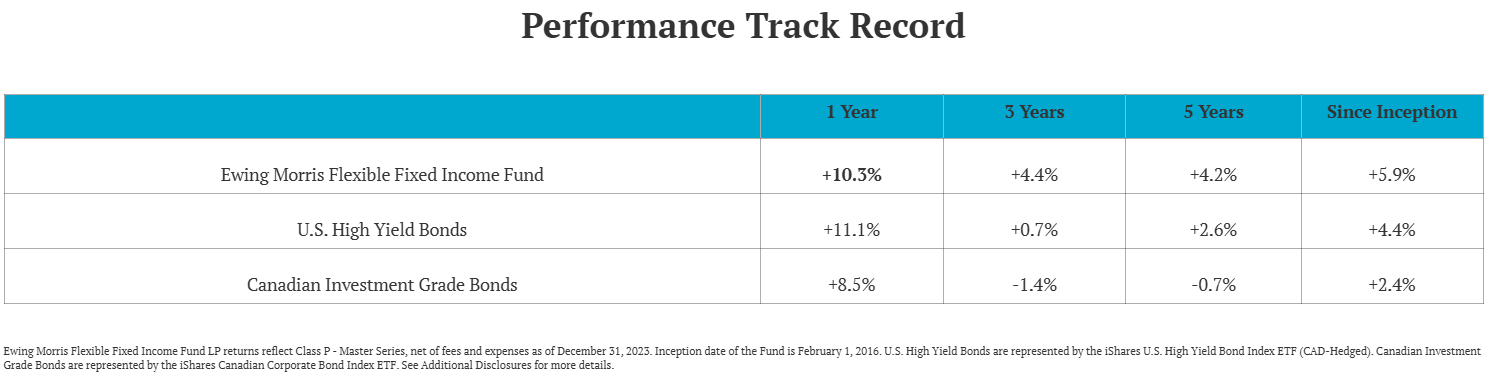
Growth of your invested capital is our foremost concern. To this end, 2023 was a successful year as the Fund returned +10.3%.*
*All Fund returns referenced reflect Class P returns, net of all fees and expenses.
On a relative basis, the Fund outpaced its High Yield and Investment Grade benchmarks for the majority of the year. As the year finished, Fund returns were overtaken by the High Yield benchmark, as all asset classes staged a pronounced rally following the dovish Federal Reserve meeting in early November.
2023 was not a year where a cautious approach was rewarded. It was a year where corporate bonds that had more risk of any kind - credit or interest rate - performed the best. Although exposures varied through the year, on average, the Fund was positioned with less credit and interest rate risk than the high yield and investment grade benchmarks, respectively.
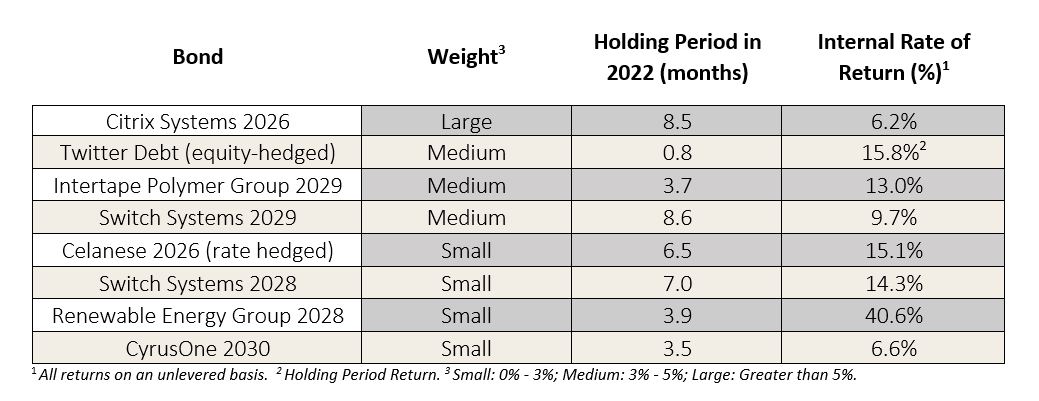
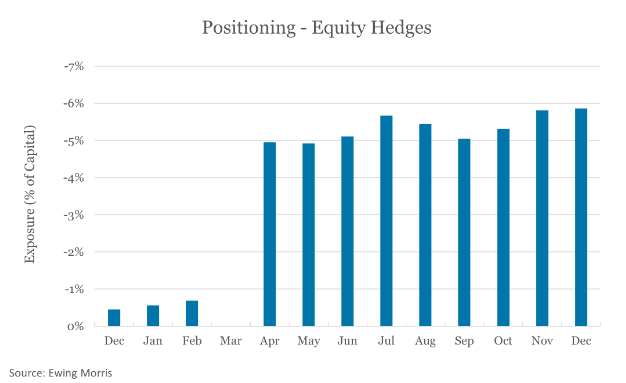
From a credit perspective, the portfolio held no CCC exposure and carried equity hedges for the majority the year. Both of these attributes positioned the fund to preserve capital in the event of a hard landing.
From an interest rate risk perspective, the fund had substantially lower duration than the investment grade market and averaged lower duration than the high yield market in the year.
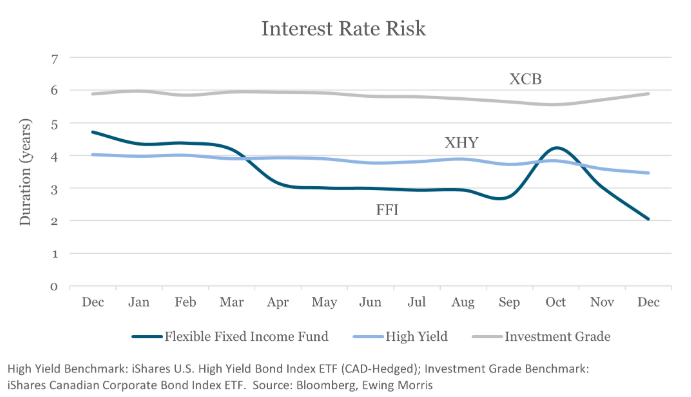
In spite of its more conservative positioning, the Fund outperformed its investment grade benchmark for the full year and largely kept pace with its high yield benchmark. This performance was principally due to strong security selection, our core discipline. We had no meaningful mishaps in the year and for the first time, on an outright basis, we allocated capital to the "highest quality" asset class: US Treasuries. The price paid: ~44 cents on the dollar. This was an astonishing reminder that what drives a AAA investment outcome is not a bond's rating. It's a bond's price.
Looking Back
The past three years serve as a more meaningful yardstick for performance evaluation. This is because a variety of market conditions were encountered over this time period.
In 2021, market returns were moderate. 2022 posed the most adverse interest rate conditions in at least a generation. 2023 showcased the most favorable yearly return in high yield since 2016.
These varied conditions underscored something important: the value of a flexible investment mandate; the ability to do something about the opportunities that no one expected to be littered across disparate parts of the market. We have unified these three years into a simple, focused summary. We will start with 2021.
2021
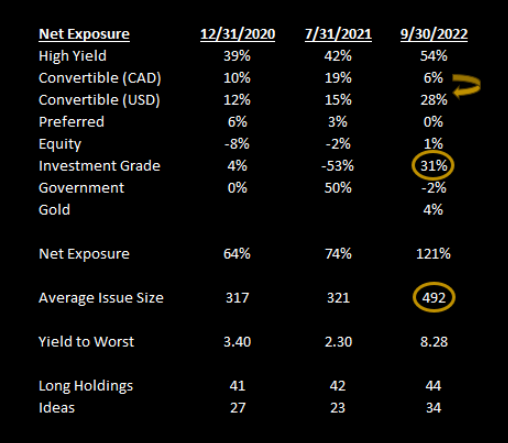
After the staggering rally in 2020, we entered 2021 with a narrowed opportunity set. As a result, the portfolio had near record low net exposure. We also maintained modest equity hedges against certain convertible bond positions, which also reduced the overall risk of the portfolio. We were positioned and ready to act opportunistically. And great investment opportunities did arise. The best example of this was in the days immediately following its takeover announcement, we made swift, significant and attractively-priced purchases of Shaw Communication's Preferred Shares.
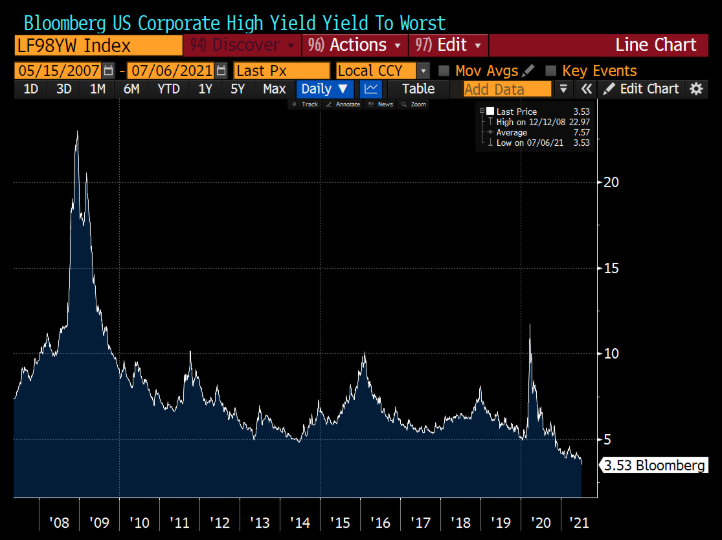
At the beginning of the year, no strategist expected high yield bond prices to rally to a level where the average bond would yield 3.5%. But by the end of July, it did.
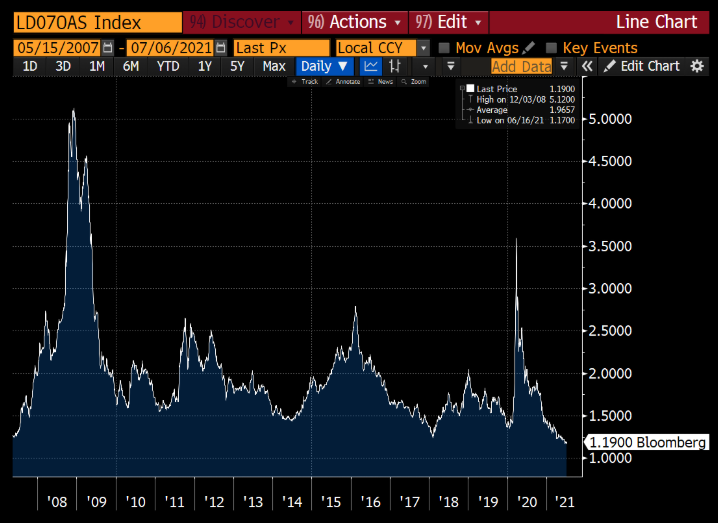
At the beginning of the year, no strategist expected long-term investment grade credit to reach pre-2008 levels, but it did too.
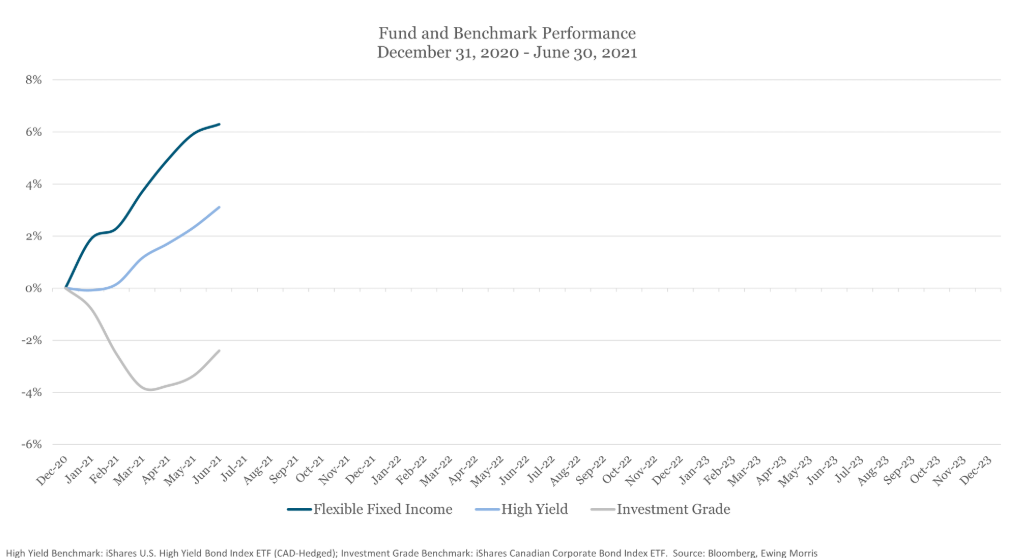
It was a swift start to the year. Through June of 2021, the Fund returned +6.2%.
Since 2020, the Fed-induced liquidity push had managers accepting any price in order to acquire bonds. The COVID-era had broken records: the US Treasury issued bonds due in 2050 at 1.25%. Google issued bonds due in 2060 at 2.25%. Scores of growth companies issued convertible bonds with less than 1% rates of interest. Even a Deli somewhere in New Jersey was worth $2 billion dollars, on paper. The environment was unsustainable. With this extreme backdrop, it was no surprise that we were finding few incremental long opportunities. So, we considered that we might be better served to see what opportunities existed on the short side of the most overbought sectors.
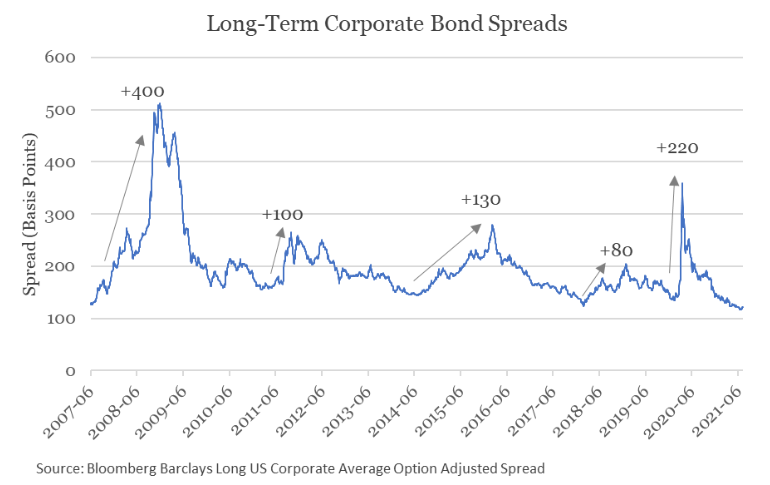
The most distorted prices we could find were in long-term "high quality" credit.
Our assessment was that there was a high probability these credit spreads, given time, could be materially higher due to several factors - debt-fueled M&A activity or inflation being two obvious ones. The investment was to produce a profit if the market’s optimism simply dimmed from its current extreme levels.
On an annual basis, the investment had a very low carrying cost. Since we were shorting a corporate bond and buying the like-maturity government bond, we were only paying the difference between the two (the "credit spread"). The annual total cost to short these credits was in the low to mid 1% range, depending on the bond.
Although we considered many factors, we favored high duration bonds. In some, duration was ~20 years. This meant that if the bond's credit spread increased by only 1 percentage point, it would produce a 20% profit in price for the position. To see a 1 percentage point increase at some point would be unlikely to surprise anyone; a move like this had already happened many times in recent memory.
We concluded that paying out a mid-1% annual premium to get this 20% profit potential was not only an excellent hedge to protect the portfolio, it was a great investment in its own right.
To execute this view, we hand-picked a collection of 38 expensive, long-dated investment grade credits to sell against treasuries via ‘portfolio trades’. The position was exceptionally liquid. It was diversified. It consumed no capital. And it consumed very little margin. For a higher resolution view, please see our Q2 2021 LP Letter.
In the second half of the year, markets softened as the omicron variant proliferated. Contributions from security selection among long positions, and early gains from our investment grade credit hedge provided stable returns through this time.
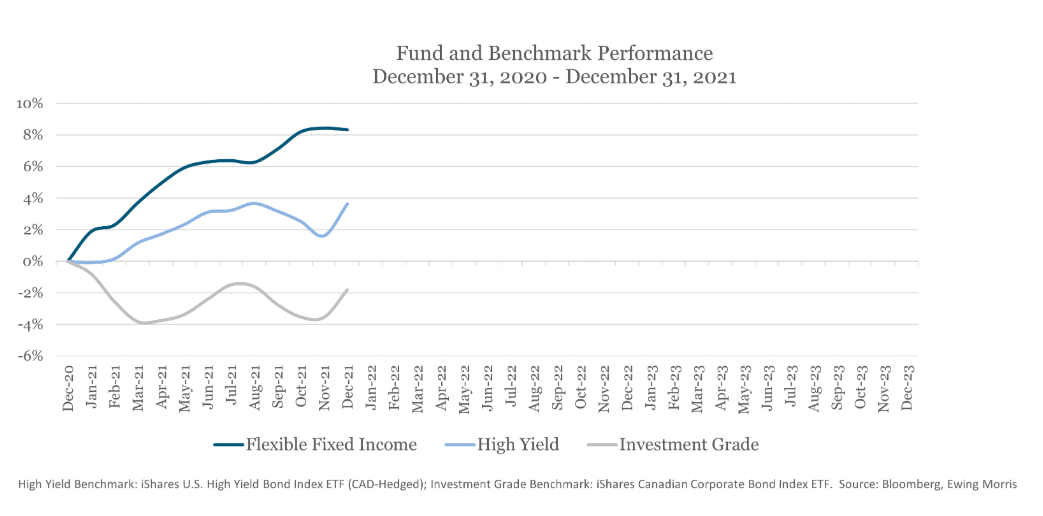
And by year-end 2021, the Fund produced a net return of +8.3%.
2022
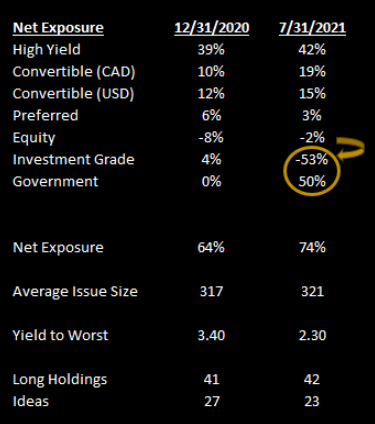
In the spring, the rapid reappraisal of inflation and central bank tightening by interest rate markets caused price declines across all asset classes. With stocks down, it was not a surprise to see credit spreads widening, allowing our portfolio hedge to contribute very well early in the year. By May, the corporate spread hedge had served its purpose and we monetized profits.
The continued change in interest rates and the price of credit produced a new opportunity set by the fall of 2022, leading to natural changes in the portfolio. Through the year, investment in our own purpose-built technology and systems enhanced our ability to identify event-driven opportunities. At this time, we found many of the most promising opportunities in the investment grade space as underpriced optionality was abundant, due to these bonds’ large discounts to par.
In addition, we reallocated a material portion of our Canadian convertible debentures into more liquid, deeply discounted convertibles in the US, most of which also contained exceptional takeout optionality.
These two changes also combined to increase the average issue size held in the portfolio, positioning us with even more flexibility as we moved through what looked like the unpleasant front edge of a credit cycle.
By the end of 2022, these historic moves in interest rates and rough credit conditions took a devastating toll on almost every facet of the fixed income market. Our hedges in investment grade and favorable bond-picking contributed greatly to results in the year; the Fund produced the strongest year of relative outperformance in its history at +6.5% versus High Yield. Unfortunately, our High Yield and Investment Grade benchmarks were down 11.2% and 9.9%, respectively. And, for the first time measured by a calendar year, the Fund declined in value. For a higher resolution view, including top contributors and unforced errors, please see our 2022 Letter.

In 2022, the Fund declined by 4.5%.
2023
As we moved through 2023, we exited the bulk of our event-driven investment grade bond investments in favor of more attractive US-based convertible bond opportunities.
In the convertible bond market, we were finding many liquid credits with management teams continuing to pivot further to debt-friendly capital allocation and operating policies. In addition to these bonds being well-supported by this fundamental and technical dynamic, technology-focused private equity sponsors continued to circle the space, underpinning the hidden option value in the convertible bond contracts' "Fundamental Change" (change of control) covenant.
We ended 2023 with a defensive posture given our high liquidity, low duration and equity hedges.

In 2023, the Fund returned +10.3%
And that was our past three years together.
Growth in our Capacity
At its most abstract, the foremost pre-requisite for generating great investment results is the capacity to produce commercial insight. If this is true, an investment manager’s focus should, perhaps to the exclusion of almost anything else, be dedicated to the design and implementation of an approach to produce and capitalize on such insight. We published a thoroughly-defined investment philosophy at the Fund’s inception, but beginning in 2021, we finally denied the Tyranny of the Urgent to evolve this area so fundamental to our work. Since this time, we have invested time redesigning, rebuilding and then refining our systems “stack” more than in all prior years combined. Our ongoing iteration and implementation continues to this day.
Combined, these systems have enhanced how and where we gather data, how we convert this data into information and commercial insight and how and where we engage in the market.
Our differentiated returns over the past three years are a testament to this new convergence of technology and judgement. In addition, groundbreaking advances in software copiloting models have also enabled us to seamlessly iterate.
The most exciting area of our work is in finding new ideas. We have deployed several, internally-developed systems to this end, which provide diversified on-ramps for idea generation. These systems increase our ability to consistently find what we call “high-potential anomalies” - situations worth investigating.
By way of a yard-sale metaphor, we've now got a high-resolution drone that, on any given Sunday, can help us spot the Patek Nautilus or Group of Seven amongst Rick's old VHS tapes, bowling trophies and mannequin heads.
Our favorite product that we have developed is our X-Ray tool, which allows us to perform 'deep scoping' work on prospective investments. The analytics span a variety of user-defined dimensions such as security valuation and corporate governance. It also includes a risk/reward landscape, expressed in 3-D space. Bloomberg, Capital IQ, Factset all do not have this functionality in fixed income, so we built it ourselves. Now we are finding these anomalies in a fraction of the time it took previously. At its core, we are tapping into more and higher quality ‘looks’ at what’s out there. This resource not only helps us compound our pattern recognition but it also allows us to raise our bar for what constitutes a great investment. We are heartened to know there’s lots of tread left on the tires of this new technology and we are leaning into this with all we have.
Outlook
It is hard to predict the weather of tomorrow, but it can be instructive looking out the window to see what’s actually here. What we are seeing is overall financial conditions that are fairly tight. We are seeing bankruptcies on the rise. And interest rate markets tell us we are on the eve a cutting cycle across multiple central banks. These factors do not obviously point to - at least initially - a rosy outlook for risk markets.
But our response to this is the same as it always has been: own bonds at valuations that should compensate us well even in the event a difficult environment comes to pass, and find hedges with positive expected value.
Perhaps most important is that the hand of interest rates has shaken the snow globe mightily for the last two years and today, we see a market of bonds containing plenty of situation-specific opportunities. The portfolio yields in the 7 percent range, has strong capital appreciation potential and we are thoroughly constructive on our ability to enhance your investment’s value in 2024. In a world where investors expect 10% from equities, we are not alone in our view that the high yield space is a very competitive alternative to equities at this point in the cycle. When we add to this possible positive surprises in the portfolio due to corporate actions, we can’t help but to look forward to the year ahead.
Thank you for your continued confidence.

Schedule a
Conversation


Connect with Peers


Explore Our Full Library


Library


Minimizing Tax Drag (Part 2)