Fellow Limited Partners,
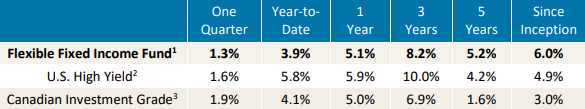
In the third quarter of 2025, the Flexible Fixed Income Fund returned +1.3%. This return compares to our publicly traded high yield and investment grade benchmarks, which returned +1.6% and +1.9%, respectively. Since its inception in early 2016, the Fund has delivered a compound annual return of 6.0%, meeting our long-term net return expectations of 5% to 7% and exceeding our benchmarks by a meaningful margin.
Performance and Positioning
Following the liberation day shock and rebound in the second quarter, markets in the third quarter were quite calm and uneventful by comparison. From a risk perspective, the Fund remains quite defensive (relative to high yield). In addition to having above-average credit quality, the portfolio continues to hold a significant hedge in US investment grade credit, covering more than half of the portfolio’s market value. These two factors have led to modestly lower relative year-to-date performance, but vastly better prospective downside protection amidst what appears to be a higher-risk investment environment. Given the high cost of hedging US dollars back to Canada, we exited many US dollar-denominated positions in the quarter. In their place, we increased our exposure to Canadian dollar-denominated high yield through several new issues. We were ready buyers of these (non-resource) issuers as these investments offered a far better yield relative to US dollar-based opportunities of similar risk profiles.
Letters as a Litmus Test
Corporate IPO’s often feature foundational letters from leadership to prospective shareholders. S-1 filing classics include Google’s 2004 “Owner’s Manual” and Facebook’s 2012 “The Hacker Way”. Amazon’s “Day 1” philosophy shared as part of its inaugural annual letter is another excellent example. At their best, these letters serve as a pure communication of culture. And to the degree they accurately reflect corporate culture, paying attention to them can be the springboard for uncovering a great investment. On the other hand, there are letters of another kind - letters that communicate something different: the current psychology of the market.
Chamath Palihapitiya’s Founder Letter for his “American Exceptionalism Special Purpose Acquisition Company” IPO is one example. After giving a plainspoken warning to its prospective investors that it is possible that they could lose all their money on this IPO, the letter concludes with this line:
“if [investors] do lose their entire capital, they will embody the adage from President Trump that there can be ‘no crying in the casino.’” This is the psychology in parts of today’s market, where investors have been gripped by a mindset of gambling and speculation that will likely end in disappointment. Suffice it to say, we are steering clear of these market avenues.
Protecting and Participating
One model of monetizing bubbles or excess is to find indirect avenues to profit that do not carry the downside of what’s happening in the central arena of play. An interesting dynamic that we are seeing is the return of the large cap LBO. No example is better than the recent $55 billion deal at Electronic Arts, which sent EA’s long bonds from 65 to 94 in one day.4 With extremely deep pools of capital found in pensions and investment offices combined with their interest in co-sponsorship and co-investment, we believe large-scale deals are more within reach than is widely appreciated. And as we’ve seen from the upside at EA, the value of finding “free options” has become a focal point for us.
Outlook
Taking a step back, looking at the private market, there are signs of a bubble in early-stage venture capital. In credit, spreads are near thirty-year lows. In equities, the stock market is breaking all time highs while a COVID-era meme-stock exchange traded fund (ticker: “MEME”) is being revived. They say “there will be signs”. We are seeing them. And while nobody knows how long this unbridled optimism will continue, we remain focused on navigating this kaleidoscopic landscape safely.
1. Ewing Morris Flexible Fixed Income Fund LP returns reflect Class P - Master Series, net of fees and expenses as of September 30, 2025. Inception date of the Fund is February 1, 2016.
2. U.S. High Yield Bonds are represented by the iShares U.S. High Yield Bond Index ETF (CAD-Hedged).
3. Canadian Investment Grade Bonds are represented by the iShares Canadian Corporate Bond Index ETF.
4. Source: Bloomberg
Inception date of the Flexible Fixed Income Fund is February 1, 2016. Flexible Fixed Income Fund returns reflect Class P - Master Series, net of fees and expenses. We have listed the iShares U.S. High Yield Bond Index ETF (CAD-Hedged) and the iShares Canadian Corporate Bond Index ETF as benchmark indices/data for the high yield and corporate bond markets, as these are widely known and used benchmark indices/data for fixed income markets. The Fund has a flexible investment mandate and thus these benchmark indices are provided for information only. Comparisons to these benchmarks and indices have limitations. Investing in fixed income securities is the primary strategy for the Fund, however the Fund does not invest in all, or necessarily any, of the securities that compose the referenced benchmark indices, and the Fund portfolio may contain, among other things, options, short positions and other securities, concentrated levels of securities and may employ leverage not found in these indices. As a result, no market indices are directly comparable to the results of the Fund. Past performance does not guarantee future returns. This letter does not constitute an offer to sell units of any Ewing Morris Fund, collectively, “Ewing Morris Funds”. Units of Ewing Morris Funds are only available to investors who meet investor suitability and sophistication requirements. While information prepared in this report is believed to be accurate, Ewing Morris & Co. Investment Partners Ltd. makes no warranty as to the completeness or accuracy nor can it accept responsibility for errors in the report. This report is not intended for public use or distribution. There can be no guarantee that any projection, forecast or opinion will be realized. All information provided is for informational purposes only and should not be construed as personal investment advice. Users of these materials are advised to conduct their own analysis prior to making any investment decision. Source for data referenced and benchmark information: Capital IQ, Bloomberg and Ewing Morris. As of September 30, 2025.
Fellow Limited Partners,
In the third quarter of 2025, the Flexible Fixed Income Fund returned +1.3%. This return compares to our publicly traded high yield and investment grade benchmarks, which returned +1.6% and +1.9%, respectively. Since its inception in early 2016, the Fund has delivered a compound annual return of 6.0%, meeting our long-term net return expectations of 5% to 7% and exceeding our benchmarks by a meaningful margin.
Performance and Positioning
Following the liberation day shock and rebound in the second quarter, markets in the third quarter were quite calm and uneventful by comparison. From a risk perspective, the Fund remains quite defensive (relative to high yield). In addition to having above-average credit quality, the portfolio continues to hold a significant hedge in US investment grade credit, covering more than half of the portfolio’s market value. These two factors have led to modestly lower relative year-to-date performance, but vastly better prospective downside protection amidst what appears to be a higher-risk investment environment. Given the high cost of hedging US dollars back to Canada, we exited many US dollar-denominated positions in the quarter. In their place, we increased our exposure to Canadian dollar-denominated high yield through several new issues. We were ready buyers of these (non-resource) issuers as these investments offered a far better yield relative to US dollar-based opportunities of similar risk profiles.
Letters as a Litmus Test
Corporate IPO’s often feature foundational letters from leadership to prospective shareholders. S-1 filing classics include Google’s 2004 “Owner’s Manual” and Facebook’s 2012 “The Hacker Way”. Amazon’s “Day 1” philosophy shared as part of its inaugural annual letter is another excellent example. At their best, these letters serve as a pure communication of culture. And to the degree they accurately reflect corporate culture, paying attention to them can be the springboard for uncovering a great investment. On the other hand, there are letters of another kind - letters that communicate something different: the current psychology of the market.
Chamath Palihapitiya’s Founder Letter for his “American Exceptionalism Special Purpose Acquisition Company” IPO is one example. After giving a plainspoken warning to its prospective investors that it is possible that they could lose all their money on this IPO, the letter concludes with this line:
“if [investors] do lose their entire capital, they will embody the adage from President Trump that there can be ‘no crying in the casino.’” This is the psychology in parts of today’s market, where investors have been gripped by a mindset of gambling and speculation that will likely end in disappointment. Suffice it to say, we are steering clear of these market avenues.
Protecting and Participating
One model of monetizing bubbles or excess is to find indirect avenues to profit that do not carry the downside of what’s happening in the central arena of play. An interesting dynamic that we are seeing is the return of the large cap LBO. No example is better than the recent $55 billion deal at Electronic Arts, which sent EA’s long bonds from 65 to 94 in one day.4 With extremely deep pools of capital found in pensions and investment offices combined with their interest in co-sponsorship and co-investment, we believe large-scale deals are more within reach than is widely appreciated. And as we’ve seen from the upside at EA, the value of finding “free options” has become a focal point for us.
Outlook
Taking a step back, looking at the private market, there are signs of a bubble in early-stage venture capital. In credit, spreads are near thirty-year lows. In equities, the stock market is breaking all time highs while a COVID-era meme-stock exchange traded fund (ticker: “MEME”) is being revived. They say “there will be signs”. We are seeing them. And while nobody knows how long this unbridled optimism will continue, we remain focused on navigating this kaleidoscopic landscape safely.
1. Ewing Morris Flexible Fixed Income Fund LP returns reflect Class P - Master Series, net of fees and expenses as of September 30, 2025. Inception date of the Fund is February 1, 2016.
2. U.S. High Yield Bonds are represented by the iShares U.S. High Yield Bond Index ETF (CAD-Hedged).
3. Canadian Investment Grade Bonds are represented by the iShares Canadian Corporate Bond Index ETF.
4. Source: Bloomberg
Inception date of the Flexible Fixed Income Fund is February 1, 2016. Flexible Fixed Income Fund returns reflect Class P - Master Series, net of fees and expenses. We have listed the iShares U.S. High Yield Bond Index ETF (CAD-Hedged) and the iShares Canadian Corporate Bond Index ETF as benchmark indices/data for the high yield and corporate bond markets, as these are widely known and used benchmark indices/data for fixed income markets. The Fund has a flexible investment mandate and thus these benchmark indices are provided for information only. Comparisons to these benchmarks and indices have limitations. Investing in fixed income securities is the primary strategy for the Fund, however the Fund does not invest in all, or necessarily any, of the securities that compose the referenced benchmark indices, and the Fund portfolio may contain, among other things, options, short positions and other securities, concentrated levels of securities and may employ leverage not found in these indices. As a result, no market indices are directly comparable to the results of the Fund. Past performance does not guarantee future returns. This letter does not constitute an offer to sell units of any Ewing Morris Fund, collectively, “Ewing Morris Funds”. Units of Ewing Morris Funds are only available to investors who meet investor suitability and sophistication requirements. While information prepared in this report is believed to be accurate, Ewing Morris & Co. Investment Partners Ltd. makes no warranty as to the completeness or accuracy nor can it accept responsibility for errors in the report. This report is not intended for public use or distribution. There can be no guarantee that any projection, forecast or opinion will be realized. All information provided is for informational purposes only and should not be construed as personal investment advice. Users of these materials are advised to conduct their own analysis prior to making any investment decision. Source for data referenced and benchmark information: Capital IQ, Bloomberg and Ewing Morris. As of September 30, 2025.

Minimizing Tax Drag (Part 2)
Any tax-conscious investor should be transfixed by the opportunities (and pitfalls) in fixed income. This is our account of the landscape.

Schedule a
Conversation


Connect with Peers


Explore Our Full Library


Library


Minimizing Tax Drag (Part 2)