Fellow Limited Partners,
In the second quarter of 2026, the Select Credit Fund returned +3.1%.
Since the strategy's inception in May of 2020, the strategy has delivered a compound annual return of 8.9%, net of all fees.

Performance
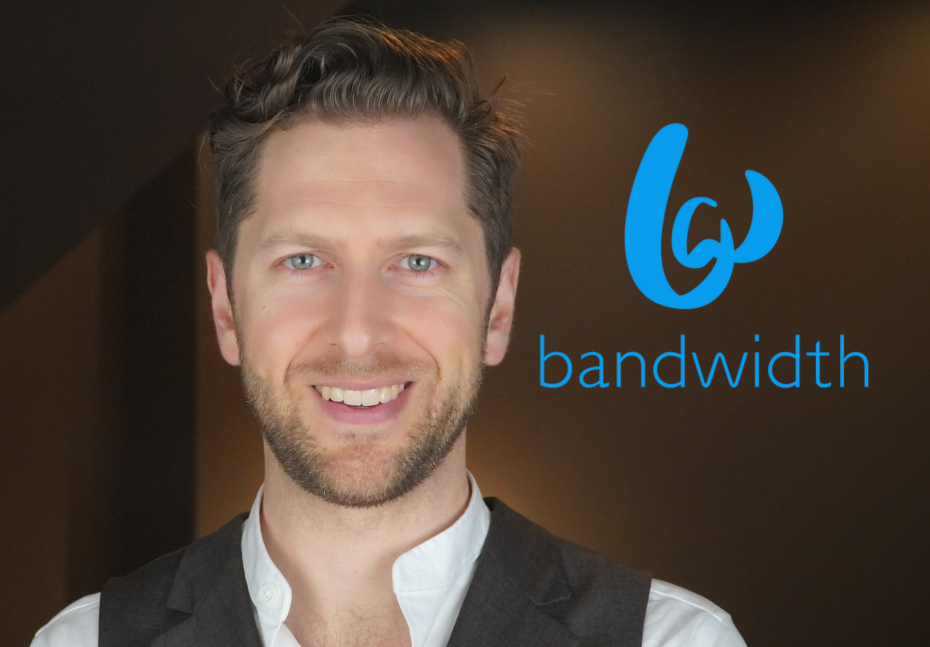
Outside of the hyperscalers which saw underperformance (a sector which we have avoided), the broader credit market was strong. Within the market, are bound in the software and internet space took shape. Securities of single names we hold, including Bandwidth, Evolent and Unity, all made meaningful advances as the ‘SaaSpocalypse’ we described last quarter abated. On the long side, Bandwidth, our top holding, was particularly notable as we participated in tendering our bonds back to the company at a very healthy premium to market pricing. The bonds we bought in the 60’s amidst extreme pessimism were exited in June at 95 cents on the dollar. On the short side – our second-largest short position over the last year and a half has been in Oracle 2054’s - an important part of our investment grade credit spread hedge. As the leading example of AI spending weakening an investment grade balance sheet, our position against Oracle’s long bonds has produced solid profits for you. In addition to our current long and short exposure across debt asset classes, we are increasingly finding opportunities at the intersection of debt and equity markets. We are seeing these opportunities particularly within the technology sector – situations where debt investors are far more negative about a company’s future than their equity counterparts.
The Market
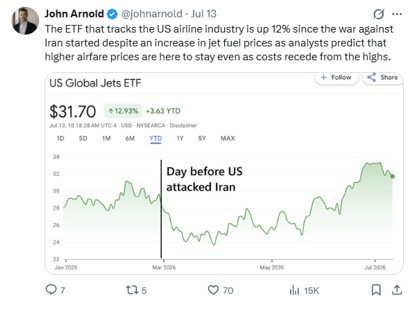
Despite the technological and geopolitical upheaval underway, markets remain optimistic. While we witnessed substantial risks to the global supply of oil, we saw no disorderly price action in the bond market, and the S&P 500 marked an all-time high in May. Quarters like this remind us just how difficult it is to predict short-term moves in stock and bond markets. Events one might think would matter, don't. And events one might think wouldn't matter, do, at least in the short term. Charlie Munger ight repeat, "If you're not a little confused by what's going on, you don't understand it." John Arnold, a renowned commodity trader, philanthropist, and Meta board member, in that chronological order, also captured this dynamic well in a recent X post about a U.S. airline ETF's reaction to the Iran war.
While equity markets may move with a long tether to reality measured in the trillions in some cases, a particularly appealing aspect of corporate debt markets is that their market values tend to stay far more closely connected to their underlying economic reality. Much of this is thanks to the fact that bonds have a terminal station for value: their maturity date.
"Everything is Hyperscaler"
When peering inside a new Tesla delivered to the White House, Donald Trump uttered a phrase that caught fire: "Everything is computer". In today's debt markets, Everything is Hyperscaler. The sheer scale of capital backing the AI infrastructure buildout is historic. And global debt markets are the foundation of this multi-trillion dollar buildout. Every facet of credit is being tapped: investment grade corporates, high yield, private debt, asset-backed and vendor finance. In Canada, Alphabet Inc. (Google's parent company) broke the Canadian corporate bond record in May by raising C$8.5 billion in bonds.3 This megadeal was then shattered by Amazon in June, which issued C$14 billion.3
Given the substantial cash generation of the hyperscalers (Google, Amazon, Meta and Oracle in particular), these companies have plenty of additional theoretical credit capacity. But practically speaking, this credit capacity will need to be supported by actual capital. And just because a credit may deserve funding, doesn't mean that capital will be available for it at a reasonable price. Although debt markets have comfortably absorbed this wave of hyperscaler debt, we can't forget that the high US fiscal deficit is also drawing in capital from the sidelines.
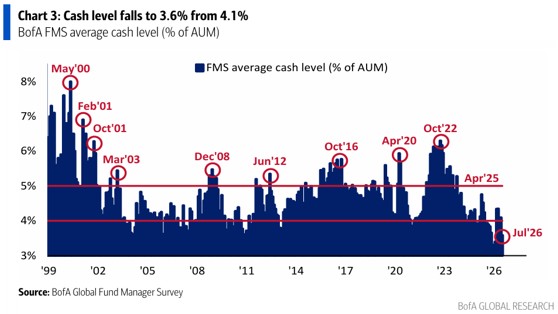
It is difficult to know exactly when a well runs dry other than finding its limit in real-time. With BofA's July Fund Manager Survey highlighting an "uber-low" average cash level of 3.6% (down from more than 6% in October 2022), we seem to be plumbing the depths of where investor cash balances have been over the last ~30 years. Even though an astute observer can find the exception and point out that cash levels in 2004 were at the same levels as today (a good entry point in equities and high yield), we would offer that in comparison with 2004, equity valuations and credit spreads are currently in a far less comfortable place.
The hyperscaler issuance wave reminds us of the expansion of the high yield energy sector from 2011 to 2015, once a new technology - fracking - was deployed at scale. As the high yield market grew on the back of energy issuance, it reached its saturation point. The structural overweight in energy, combined with a catalyzing event in the OPEC-induced supply glut, caused bond prices in the sector to hit levels no one would have expected. This is a space that became "over-owned". The same may become true for the hyperscalers. Given the huge sums of capital at play and potential for dislocation and opportunity, we are paying more and more attention to this growing facet of the market.
Bonds versus Stocks
We are also finding opportunity in the relative value between the debt and equity of the same company. The pattern tends to look like this: the debt sees a bleak future and is underpriced; the equity sees a great future and is overpriced. The truth is usually somewhere in the middle.
We see this in software, where a business often generates high free cash flow, holds options to shrink its cost base and carries revenues with reasonable durability. In these cases, the discounted debt can be attractive on its own merits, while the equity does not seem to be baking in its new, higher cost of debt capital, nor the rough headwind of stock-based compensation borne by a vastly smaller equity base.
We also see this in the capital-intensive corners of the AI value chain, particularly the so-called 'neoclouds', where stock investors are paying up for a blue-sky growth narrative while ignoring the very real costs of a depreciating asset (chips), that the bonds are fearfully pricing in. In situations like these, we can build positions that have potential to profit as reality asserts itself in favor of either view.
Outlook
The world has embarked on an economic project of a scale rarely seen - trillions of dollars committed to building out AI infrastructure, increasingly financed through the debt markets. Although these things take time and the path from here is unknowable in advance, a lot is likely to happen along the way. As the energy sector demonstrated a decade ago, growth financed this quickly does not always end smoothly.
With capital market conditions at such extremes (record single-stock valuations, record debt issuance), we are pleased to see the landscape's opportunity set, particularly on a relative value basis, is expanding.
Thank you for your investment in the Ewing Morris Select Credit Fund LP.
1. Ewing Morris Select Credit Fund LP returns reflect Class P, net of fees and expenses as of June 30, 2026. Inception date of the strategy is April 29, 2020. See Additional Disclosures below.
2. U.S. High Yield Bonds are represented by the iShares U.S. High Yield Bond Index ETF (CAD-Hedged). See Additional Disclosures below.
3. Company Filings and Bloomberg.
Performance is based on returns for the Ewing Morris Select Credit Fund LP. The inception date of the strategy is April 29, 2020. As of May 1, 2025, returns are based on Class P, net of fees and expenses. Class P units bear management fees of 0.75% per annum, as well as performance fees, as applicable. From February 1, 2025 to April 30, 2025, the returns presented were those of Class S of the Fund, which bear management fees of 0.5% per annum, as well as performance fees, as applicable. From April 29, 2020 to January 31, 2025, returns are based on a separately managed account that shared a similar investment objective and strategy as the Ewing Morris Select Credit Fund LP and were calculated net of fees and expenses matching those of Class P. While the Fund's overall investment objective remains the same, past performance is not indicative of future performance. Where the performance period is longer than 12 months, returns are annualized. The 2020 return represents performance from the inception of the Fund to December 31, 2020. Please note that firm AUM is an estimate until all NAVs are finalized. Percentages may not add up to 100% due to rounding to the nearest percent. The U.S. High Yield Bond Benchmark is represented by the iShares U.S. High Yield Bond Index ETF (CAD-Hedged) (TSX: XHY). This benchmark has been selected for the Ewing Morris Select Credit Fund LP because it is a low-cost, index-tracking fund, representative of an individual's opportunity cost in higher-yield fixed income, and is a widely known and followed fixed income benchmark. These benchmark indices are provided for informational purposes only, and comparisons to benchmarks and indices have limitations. Investing in fixed income securities is the primary strategy of the Fund; however, the Fund does not invest in all, or necessarily any, of the securities that comprise the referenced benchmark indices. The Fund's portfolio may contain, among other things, options, short positions, other securities, concentrated positions, and may employ leverage that is not reflected in these indices. As a result, no market index is directly comparable to the results of the Fund. Returns are unaudited. This letter does not constitute an offer to sell units of any Ewing Morris Fund, collectively referred to as "Ewing Morris Funds." Units of Ewing Morris Funds are only available to investors who meet applicable suitability and sophistication requirements. Source for data referenced and benchmark information: Capital IQ, Bloomberg and Ewing Morris. As of June 30, 2026.
Fellow Limited Partners,
In the second quarter of 2026, the Select Credit Fund returned +3.1%.
Since the strategy's inception in May of 2020, the strategy has delivered a compound annual return of 8.9%, net of all fees.
Performance
Outside of the hyperscalers which saw underperformance (a sector which we have avoided), the broader credit market was strong. Within the market, are bound in the software and internet space took shape. Securities of single names we hold, including Bandwidth, Evolent and Unity, all made meaningful advances as the ‘SaaSpocalypse’ we described last quarter abated. On the long side, Bandwidth, our top holding, was particularly notable as we participated in tendering our bonds back to the company at a very healthy premium to market pricing. The bonds we bought in the 60’s amidst extreme pessimism were exited in June at 95 cents on the dollar. On the short side – our second-largest short position over the last year and a half has been in Oracle 2054’s - an important part of our investment grade credit spread hedge. As the leading example of AI spending weakening an investment grade balance sheet, our position against Oracle’s long bonds has produced solid profits for you. In addition to our current long and short exposure across debt asset classes, we are increasingly finding opportunities at the intersection of debt and equity markets. We are seeing these opportunities particularly within the technology sector – situations where debt investors are far more negative about a company’s future than their equity counterparts.
The Market
Despite the technological and geopolitical upheaval underway, markets remain optimistic. While we witnessed substantial risks to the global supply of oil, we saw no disorderly price action in the bond market, and the S&P 500 marked an all-time high in May. Quarters like this remind us just how difficult it is to predict short-term moves in stock and bond markets. Events one might think would matter, don't. And events one might think wouldn't matter, do, at least in the short term. Charlie Munger ight repeat, "If you're not a little confused by what's going on, you don't understand it." John Arnold, a renowned commodity trader, philanthropist, and Meta board member, in that chronological order, also captured this dynamic well in a recent X post about a U.S. airline ETF's reaction to the Iran war.
While equity markets may move with a long tether to reality measured in the trillions in some cases, a particularly appealing aspect of corporate debt markets is that their market values tend to stay far more closely connected to their underlying economic reality. Much of this is thanks to the fact that bonds have a terminal station for value: their maturity date.
"Everything is Hyperscaler"
When peering inside a new Tesla delivered to the White House, Donald Trump uttered a phrase that caught fire: "Everything is computer". In today's debt markets, Everything is Hyperscaler. The sheer scale of capital backing the AI infrastructure buildout is historic. And global debt markets are the foundation of this multi-trillion dollar buildout. Every facet of credit is being tapped: investment grade corporates, high yield, private debt, asset-backed and vendor finance. In Canada, Alphabet Inc. (Google's parent company) broke the Canadian corporate bond record in May by raising C$8.5 billion in bonds.3 This megadeal was then shattered by Amazon in June, which issued C$14 billion.3
Given the substantial cash generation of the hyperscalers (Google, Amazon, Meta and Oracle in particular), these companies have plenty of additional theoretical credit capacity. But practically speaking, this credit capacity will need to be supported by actual capital. And just because a credit may deserve funding, doesn't mean that capital will be available for it at a reasonable price. Although debt markets have comfortably absorbed this wave of hyperscaler debt, we can't forget that the high US fiscal deficit is also drawing in capital from the sidelines.
It is difficult to know exactly when a well runs dry other than finding its limit in real-time. With BofA's July Fund Manager Survey highlighting an "uber-low" average cash level of 3.6% (down from more than 6% in October 2022), we seem to be plumbing the depths of where investor cash balances have been over the last ~30 years. Even though an astute observer can find the exception and point out that cash levels in 2004 were at the same levels as today (a good entry point in equities and high yield), we would offer that in comparison with 2004, equity valuations and credit spreads are currently in a far less comfortable place.
The hyperscaler issuance wave reminds us of the expansion of the high yield energy sector from 2011 to 2015, once a new technology - fracking - was deployed at scale. As the high yield market grew on the back of energy issuance, it reached its saturation point. The structural overweight in energy, combined with a catalyzing event in the OPEC-induced supply glut, caused bond prices in the sector to hit levels no one would have expected. This is a space that became "over-owned". The same may become true for the hyperscalers. Given the huge sums of capital at play and potential for dislocation and opportunity, we are paying more and more attention to this growing facet of the market.
Bonds versus Stocks
We are also finding opportunity in the relative value between the debt and equity of the same company. The pattern tends to look like this: the debt sees a bleak future and is underpriced; the equity sees a great future and is overpriced. The truth is usually somewhere in the middle.
We see this in software, where a business often generates high free cash flow, holds options to shrink its cost base and carries revenues with reasonable durability. In these cases, the discounted debt can be attractive on its own merits, while the equity does not seem to be baking in its new, higher cost of debt capital, nor the rough headwind of stock-based compensation borne by a vastly smaller equity base.
We also see this in the capital-intensive corners of the AI value chain, particularly the so-called 'neoclouds', where stock investors are paying up for a blue-sky growth narrative while ignoring the very real costs of a depreciating asset (chips), that the bonds are fearfully pricing in. In situations like these, we can build positions that have potential to profit as reality asserts itself in favor of either view.
Outlook
The world has embarked on an economic project of a scale rarely seen - trillions of dollars committed to building out AI infrastructure, increasingly financed through the debt markets. Although these things take time and the path from here is unknowable in advance, a lot is likely to happen along the way. As the energy sector demonstrated a decade ago, growth financed this quickly does not always end smoothly.
With capital market conditions at such extremes (record single-stock valuations, record debt issuance), we are pleased to see the landscape's opportunity set, particularly on a relative value basis, is expanding.
Thank you for your investment in the Ewing Morris Select Credit Fund LP.
1. Ewing Morris Select Credit Fund LP returns reflect Class P, net of fees and expenses as of June 30, 2026. Inception date of the strategy is April 29, 2020. See Additional Disclosures below.
2. U.S. High Yield Bonds are represented by the iShares U.S. High Yield Bond Index ETF (CAD-Hedged). See Additional Disclosures below.
3. Company Filings and Bloomberg.
Performance is based on returns for the Ewing Morris Select Credit Fund LP. The inception date of the strategy is April 29, 2020. As of May 1, 2025, returns are based on Class P, net of fees and expenses. Class P units bear management fees of 0.75% per annum, as well as performance fees, as applicable. From February 1, 2025 to April 30, 2025, the returns presented were those of Class S of the Fund, which bear management fees of 0.5% per annum, as well as performance fees, as applicable. From April 29, 2020 to January 31, 2025, returns are based on a separately managed account that shared a similar investment objective and strategy as the Ewing Morris Select Credit Fund LP and were calculated net of fees and expenses matching those of Class P. While the Fund's overall investment objective remains the same, past performance is not indicative of future performance. Where the performance period is longer than 12 months, returns are annualized. The 2020 return represents performance from the inception of the Fund to December 31, 2020. Please note that firm AUM is an estimate until all NAVs are finalized. Percentages may not add up to 100% due to rounding to the nearest percent. The U.S. High Yield Bond Benchmark is represented by the iShares U.S. High Yield Bond Index ETF (CAD-Hedged) (TSX: XHY). This benchmark has been selected for the Ewing Morris Select Credit Fund LP because it is a low-cost, index-tracking fund, representative of an individual's opportunity cost in higher-yield fixed income, and is a widely known and followed fixed income benchmark. These benchmark indices are provided for informational purposes only, and comparisons to benchmarks and indices have limitations. Investing in fixed income securities is the primary strategy of the Fund; however, the Fund does not invest in all, or necessarily any, of the securities that comprise the referenced benchmark indices. The Fund's portfolio may contain, among other things, options, short positions, other securities, concentrated positions, and may employ leverage that is not reflected in these indices. As a result, no market index is directly comparable to the results of the Fund. Returns are unaudited. This letter does not constitute an offer to sell units of any Ewing Morris Fund, collectively referred to as "Ewing Morris Funds." Units of Ewing Morris Funds are only available to investors who meet applicable suitability and sophistication requirements. Source for data referenced and benchmark information: Capital IQ, Bloomberg and Ewing Morris. As of June 30, 2026.
Fellow Limited Partners,
In the second quarter of 2026, the Select Credit Fund returned +3.1%.
Since the strategy's inception in May of 2020, the strategy has delivered a compound annual return of 8.9%, net of all fees.
Performance
Outside of the hyperscalers which saw underperformance (a sector which we have avoided), the broader credit market was strong. Within the market, are bound in the software and internet space took shape. Securities of single names we hold, including Bandwidth, Evolent and Unity, all made meaningful advances as the ‘SaaSpocalypse’ we described last quarter abated. On the long side, Bandwidth, our top holding, was particularly notable as we participated in tendering our bonds back to the company at a very healthy premium to market pricing. The bonds we bought in the 60’s amidst extreme pessimism were exited in June at 95 cents on the dollar. On the short side – our second-largest short position over the last year and a half has been in Oracle 2054’s - an important part of our investment grade credit spread hedge. As the leading example of AI spending weakening an investment grade balance sheet, our position against Oracle’s long bonds has produced solid profits for you. In addition to our current long and short exposure across debt asset classes, we are increasingly finding opportunities at the intersection of debt and equity markets. We are seeing these opportunities particularly within the technology sector – situations where debt investors are far more negative about a company’s future than their equity counterparts.
The Market
Despite the technological and geopolitical upheaval underway, markets remain optimistic. While we witnessed substantial risks to the global supply of oil, we saw no disorderly price action in the bond market, and the S&P 500 marked an all-time high in May. Quarters like this remind us just how difficult it is to predict short-term moves in stock and bond markets. Events one might think would matter, don't. And events one might think wouldn't matter, do, at least in the short term. Charlie Munger ight repeat, "If you're not a little confused by what's going on, you don't understand it." John Arnold, a renowned commodity trader, philanthropist, and Meta board member, in that chronological order, also captured this dynamic well in a recent X post about a U.S. airline ETF's reaction to the Iran war.
While equity markets may move with a long tether to reality measured in the trillions in some cases, a particularly appealing aspect of corporate debt markets is that their market values tend to stay far more closely connected to their underlying economic reality. Much of this is thanks to the fact that bonds have a terminal station for value: their maturity date.
"Everything is Hyperscaler"
When peering inside a new Tesla delivered to the White House, Donald Trump uttered a phrase that caught fire: "Everything is computer". In today's debt markets, Everything is Hyperscaler. The sheer scale of capital backing the AI infrastructure buildout is historic. And global debt markets are the foundation of this multi-trillion dollar buildout. Every facet of credit is being tapped: investment grade corporates, high yield, private debt, asset-backed and vendor finance. In Canada, Alphabet Inc. (Google's parent company) broke the Canadian corporate bond record in May by raising C$8.5 billion in bonds.3 This megadeal was then shattered by Amazon in June, which issued C$14 billion.3
Given the substantial cash generation of the hyperscalers (Google, Amazon, Meta and Oracle in particular), these companies have plenty of additional theoretical credit capacity. But practically speaking, this credit capacity will need to be supported by actual capital. And just because a credit may deserve funding, doesn't mean that capital will be available for it at a reasonable price. Although debt markets have comfortably absorbed this wave of hyperscaler debt, we can't forget that the high US fiscal deficit is also drawing in capital from the sidelines.
It is difficult to know exactly when a well runs dry other than finding its limit in real-time. With BofA's July Fund Manager Survey highlighting an "uber-low" average cash level of 3.6% (down from more than 6% in October 2022), we seem to be plumbing the depths of where investor cash balances have been over the last ~30 years. Even though an astute observer can find the exception and point out that cash levels in 2004 were at the same levels as today (a good entry point in equities and high yield), we would offer that in comparison with 2004, equity valuations and credit spreads are currently in a far less comfortable place.
The hyperscaler issuance wave reminds us of the expansion of the high yield energy sector from 2011 to 2015, once a new technology - fracking - was deployed at scale. As the high yield market grew on the back of energy issuance, it reached its saturation point. The structural overweight in energy, combined with a catalyzing event in the OPEC-induced supply glut, caused bond prices in the sector to hit levels no one would have expected. This is a space that became "over-owned". The same may become true for the hyperscalers. Given the huge sums of capital at play and potential for dislocation and opportunity, we are paying more and more attention to this growing facet of the market.
Bonds versus Stocks
We are also finding opportunity in the relative value between the debt and equity of the same company. The pattern tends to look like this: the debt sees a bleak future and is underpriced; the equity sees a great future and is overpriced. The truth is usually somewhere in the middle.
We see this in software, where a business often generates high free cash flow, holds options to shrink its cost base and carries revenues with reasonable durability. In these cases, the discounted debt can be attractive on its own merits, while the equity does not seem to be baking in its new, higher cost of debt capital, nor the rough headwind of stock-based compensation borne by a vastly smaller equity base.
We also see this in the capital-intensive corners of the AI value chain, particularly the so-called 'neoclouds', where stock investors are paying up for a blue-sky growth narrative while ignoring the very real costs of a depreciating asset (chips), that the bonds are fearfully pricing in. In situations like these, we can build positions that have potential to profit as reality asserts itself in favor of either view.
Outlook
The world has embarked on an economic project of a scale rarely seen - trillions of dollars committed to building out AI infrastructure, increasingly financed through the debt markets. Although these things take time and the path from here is unknowable in advance, a lot is likely to happen along the way. As the energy sector demonstrated a decade ago, growth financed this quickly does not always end smoothly.
With capital market conditions at such extremes (record single-stock valuations, record debt issuance), we are pleased to see the landscape's opportunity set, particularly on a relative value basis, is expanding.
Thank you for your investment in the Ewing Morris Select Credit Fund LP.
1. Ewing Morris Select Credit Fund LP returns reflect Class P, net of fees and expenses as of June 30, 2026. Inception date of the strategy is April 29, 2020. See Additional Disclosures below.
2. U.S. High Yield Bonds are represented by the iShares U.S. High Yield Bond Index ETF (CAD-Hedged). See Additional Disclosures below.
3. Company Filings and Bloomberg.
Performance is based on returns for the Ewing Morris Select Credit Fund LP. The inception date of the strategy is April 29, 2020. As of May 1, 2025, returns are based on Class P, net of fees and expenses. Class P units bear management fees of 0.75% per annum, as well as performance fees, as applicable. From February 1, 2025 to April 30, 2025, the returns presented were those of Class S of the Fund, which bear management fees of 0.5% per annum, as well as performance fees, as applicable. From April 29, 2020 to January 31, 2025, returns are based on a separately managed account that shared a similar investment objective and strategy as the Ewing Morris Select Credit Fund LP and were calculated net of fees and expenses matching those of Class P. While the Fund's overall investment objective remains the same, past performance is not indicative of future performance. Where the performance period is longer than 12 months, returns are annualized. The 2020 return represents performance from the inception of the Fund to December 31, 2020. Please note that firm AUM is an estimate until all NAVs are finalized. Percentages may not add up to 100% due to rounding to the nearest percent. The U.S. High Yield Bond Benchmark is represented by the iShares U.S. High Yield Bond Index ETF (CAD-Hedged) (TSX: XHY). This benchmark has been selected for the Ewing Morris Select Credit Fund LP because it is a low-cost, index-tracking fund, representative of an individual's opportunity cost in higher-yield fixed income, and is a widely known and followed fixed income benchmark. These benchmark indices are provided for informational purposes only, and comparisons to benchmarks and indices have limitations. Investing in fixed income securities is the primary strategy of the Fund; however, the Fund does not invest in all, or necessarily any, of the securities that comprise the referenced benchmark indices. The Fund's portfolio may contain, among other things, options, short positions, other securities, concentrated positions, and may employ leverage that is not reflected in these indices. As a result, no market index is directly comparable to the results of the Fund. Returns are unaudited. This letter does not constitute an offer to sell units of any Ewing Morris Fund, collectively referred to as "Ewing Morris Funds." Units of Ewing Morris Funds are only available to investors who meet applicable suitability and sophistication requirements. Source for data referenced and benchmark information: Capital IQ, Bloomberg and Ewing Morris. As of June 30, 2026.
Fellow Limited Partners,
In the second quarter of 2026, the Select Credit Fund returned +3.1%.
Since the strategy's inception in May of 2020, the strategy has delivered a compound annual return of 8.9%, net of all fees.
Performance
Outside of the hyperscalers which saw underperformance (a sector which we have avoided), the broader credit market was strong. Within the market, are bound in the software and internet space took shape. Securities of single names we hold, including Bandwidth, Evolent and Unity, all made meaningful advances as the ‘SaaSpocalypse’ we described last quarter abated. On the long side, Bandwidth, our top holding, was particularly notable as we participated in tendering our bonds back to the company at a very healthy premium to market pricing. The bonds we bought in the 60’s amidst extreme pessimism were exited in June at 95 cents on the dollar. On the short side – our second-largest short position over the last year and a half has been in Oracle 2054’s - an important part of our investment grade credit spread hedge. As the leading example of AI spending weakening an investment grade balance sheet, our position against Oracle’s long bonds has produced solid profits for you. In addition to our current long and short exposure across debt asset classes, we are increasingly finding opportunities at the intersection of debt and equity markets. We are seeing these opportunities particularly within the technology sector – situations where debt investors are far more negative about a company’s future than their equity counterparts.
The Market
Despite the technological and geopolitical upheaval underway, markets remain optimistic. While we witnessed substantial risks to the global supply of oil, we saw no disorderly price action in the bond market, and the S&P 500 marked an all-time high in May. Quarters like this remind us just how difficult it is to predict short-term moves in stock and bond markets. Events one might think would matter, don't. And events one might think wouldn't matter, do, at least in the short term. Charlie Munger ight repeat, "If you're not a little confused by what's going on, you don't understand it." John Arnold, a renowned commodity trader, philanthropist, and Meta board member, in that chronological order, also captured this dynamic well in a recent X post about a U.S. airline ETF's reaction to the Iran war.
While equity markets may move with a long tether to reality measured in the trillions in some cases, a particularly appealing aspect of corporate debt markets is that their market values tend to stay far more closely connected to their underlying economic reality. Much of this is thanks to the fact that bonds have a terminal station for value: their maturity date.
"Everything is Hyperscaler"
When peering inside a new Tesla delivered to the White House, Donald Trump uttered a phrase that caught fire: "Everything is computer". In today's debt markets, Everything is Hyperscaler. The sheer scale of capital backing the AI infrastructure buildout is historic. And global debt markets are the foundation of this multi-trillion dollar buildout. Every facet of credit is being tapped: investment grade corporates, high yield, private debt, asset-backed and vendor finance. In Canada, Alphabet Inc. (Google's parent company) broke the Canadian corporate bond record in May by raising C$8.5 billion in bonds.3 This megadeal was then shattered by Amazon in June, which issued C$14 billion.3
Given the substantial cash generation of the hyperscalers (Google, Amazon, Meta and Oracle in particular), these companies have plenty of additional theoretical credit capacity. But practically speaking, this credit capacity will need to be supported by actual capital. And just because a credit may deserve funding, doesn't mean that capital will be available for it at a reasonable price. Although debt markets have comfortably absorbed this wave of hyperscaler debt, we can't forget that the high US fiscal deficit is also drawing in capital from the sidelines.
It is difficult to know exactly when a well runs dry other than finding its limit in real-time. With BofA's July Fund Manager Survey highlighting an "uber-low" average cash level of 3.6% (down from more than 6% in October 2022), we seem to be plumbing the depths of where investor cash balances have been over the last ~30 years. Even though an astute observer can find the exception and point out that cash levels in 2004 were at the same levels as today (a good entry point in equities and high yield), we would offer that in comparison with 2004, equity valuations and credit spreads are currently in a far less comfortable place.
The hyperscaler issuance wave reminds us of the expansion of the high yield energy sector from 2011 to 2015, once a new technology - fracking - was deployed at scale. As the high yield market grew on the back of energy issuance, it reached its saturation point. The structural overweight in energy, combined with a catalyzing event in the OPEC-induced supply glut, caused bond prices in the sector to hit levels no one would have expected. This is a space that became "over-owned". The same may become true for the hyperscalers. Given the huge sums of capital at play and potential for dislocation and opportunity, we are paying more and more attention to this growing facet of the market.
Bonds versus Stocks
We are also finding opportunity in the relative value between the debt and equity of the same company. The pattern tends to look like this: the debt sees a bleak future and is underpriced; the equity sees a great future and is overpriced. The truth is usually somewhere in the middle.
We see this in software, where a business often generates high free cash flow, holds options to shrink its cost base and carries revenues with reasonable durability. In these cases, the discounted debt can be attractive on its own merits, while the equity does not seem to be baking in its new, higher cost of debt capital, nor the rough headwind of stock-based compensation borne by a vastly smaller equity base.
We also see this in the capital-intensive corners of the AI value chain, particularly the so-called 'neoclouds', where stock investors are paying up for a blue-sky growth narrative while ignoring the very real costs of a depreciating asset (chips), that the bonds are fearfully pricing in. In situations like these, we can build positions that have potential to profit as reality asserts itself in favor of either view.
Outlook
The world has embarked on an economic project of a scale rarely seen - trillions of dollars committed to building out AI infrastructure, increasingly financed through the debt markets. Although these things take time and the path from here is unknowable in advance, a lot is likely to happen along the way. As the energy sector demonstrated a decade ago, growth financed this quickly does not always end smoothly.
With capital market conditions at such extremes (record single-stock valuations, record debt issuance), we are pleased to see the landscape's opportunity set, particularly on a relative value basis, is expanding.
Thank you for your investment in the Ewing Morris Select Credit Fund LP.
1. Ewing Morris Select Credit Fund LP returns reflect Class P, net of fees and expenses as of June 30, 2026. Inception date of the strategy is April 29, 2020. See Additional Disclosures below.
2. U.S. High Yield Bonds are represented by the iShares U.S. High Yield Bond Index ETF (CAD-Hedged). See Additional Disclosures below.
3. Company Filings and Bloomberg.
Performance is based on returns for the Ewing Morris Select Credit Fund LP. The inception date of the strategy is April 29, 2020. As of May 1, 2025, returns are based on Class P, net of fees and expenses. Class P units bear management fees of 0.75% per annum, as well as performance fees, as applicable. From February 1, 2025 to April 30, 2025, the returns presented were those of Class S of the Fund, which bear management fees of 0.5% per annum, as well as performance fees, as applicable. From April 29, 2020 to January 31, 2025, returns are based on a separately managed account that shared a similar investment objective and strategy as the Ewing Morris Select Credit Fund LP and were calculated net of fees and expenses matching those of Class P. While the Fund's overall investment objective remains the same, past performance is not indicative of future performance. Where the performance period is longer than 12 months, returns are annualized. The 2020 return represents performance from the inception of the Fund to December 31, 2020. Please note that firm AUM is an estimate until all NAVs are finalized. Percentages may not add up to 100% due to rounding to the nearest percent. The U.S. High Yield Bond Benchmark is represented by the iShares U.S. High Yield Bond Index ETF (CAD-Hedged) (TSX: XHY). This benchmark has been selected for the Ewing Morris Select Credit Fund LP because it is a low-cost, index-tracking fund, representative of an individual's opportunity cost in higher-yield fixed income, and is a widely known and followed fixed income benchmark. These benchmark indices are provided for informational purposes only, and comparisons to benchmarks and indices have limitations. Investing in fixed income securities is the primary strategy of the Fund; however, the Fund does not invest in all, or necessarily any, of the securities that comprise the referenced benchmark indices. The Fund's portfolio may contain, among other things, options, short positions, other securities, concentrated positions, and may employ leverage that is not reflected in these indices. As a result, no market index is directly comparable to the results of the Fund. Returns are unaudited. This letter does not constitute an offer to sell units of any Ewing Morris Fund, collectively referred to as "Ewing Morris Funds." Units of Ewing Morris Funds are only available to investors who meet applicable suitability and sophistication requirements. Source for data referenced and benchmark information: Capital IQ, Bloomberg and Ewing Morris. As of June 30, 2026.

Minimizing Tax Drag (Part 1)
In equities, it's about what you make. In fixed income, it's very much about what you keep.

Schedule a
Conversation




Connect with Peers



Explore Our Full Library



Library







Minimizing Tax Drag (Part 2)